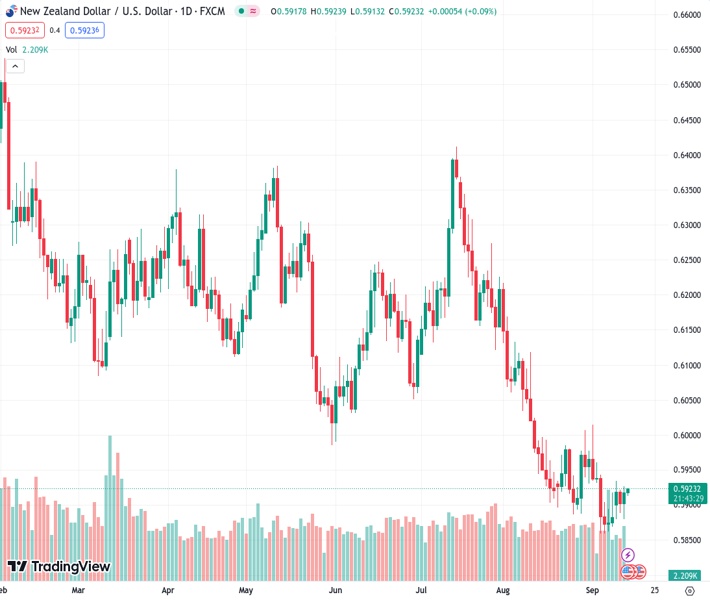
The currency pair NZD/USD is currently trading at a price of 0.5917, which is a decrease of 0.01% from its earlier value of 0.59221. This drop in value occurred after it was unable to surpass the daily high of 0.5935 that was reached on September 11.
…
This is a premium post.
[s2If !current_user_can(access_s2member_level4)]Please register for FREE REGISTER to read full post below containing analysis. In case of any error or you think you are not able to read the full post below, please email us at support#nehcap.com [lwa][/s2If] [s2If current_user_can(access_s2member_level1)]
- NZD/USD trades at 0.5917, down 0.01%, after failing to break the September 11 daily high of 0.5935.
The pair currently trades last at 0.59221.
The previous day high was 0.5931 while the previous day low was 0.5889. The daily 38.2% Fib levels comes at 0.5905, expected to provide support. Similarly, the daily 61.8% fib level is at 0.5915, expected to provide support.
The New Zealand Dollar (NZD) printed gains against the US Dollar (USD) of 0.26% on Wednesday, following a mixed US inflation report, leaving the door open for the US Federal Reserve to tighten monetary policy. As Thursday’s Asian session begins, the NZD/USD trades at 0.5917, registering minuscule losses of 0.01%.
The daily chart depicts the pair as neutral to downward biased, consolidated within the year’s lows, at around 0.5920s. Despite trading near the week’s highs, the currency pair has failed to crack the September 11 daily high at 0.5935, which could open the door for further upside, exposing the 0.5950 and the September 1 swing high at 0.6015.
Conversely, if the NZD/USD extends its losses past the September 13 swing low of 0.5879, that would exacerbate a test of the year-to-date (YTD) low of 0.5859, followed by the November 3 daily low of 0.5740. A breach of the latter, the NZD/USD would reverse the last uptrend, which began around the October 13 low of 0.5512.
Technical Levels: Supports and Resistances
NZDUSD currently trading at 0.5921 at the time of writing. Pair opened at 0.5904 and is trading with a change of 0.29 % .
| Overview | Overview.1 | |
|---|---|---|
| 0 | Today last price | 0.5921 |
| 1 | Today Daily Change | 0.0017 |
| 2 | Today Daily Change % | 0.2900 |
| 3 | Today daily open | 0.5904 |
The pair remains strongly bearish on the daily time frame. It trades below the 20 SMA @ 0.5925, 50 SMA 0.607, 100 SMA @ 0.6119 and 200 SMA @ 0.6207.
| Trends | Trends.1 | |
|---|---|---|
| 0 | Daily SMA20 | 0.5925 |
| 1 | Daily SMA50 | 0.6070 |
| 2 | Daily SMA100 | 0.6119 |
| 3 | Daily SMA200 | 0.6207 |
The previous day high was 0.5931 while the previous day low was 0.5889. The daily 38.2% Fib levels comes at 0.5905, expected to provide support. Similarly, the daily 61.8% fib level is at 0.5915, expected to provide support.
Note the levels of interest below:
- Pivot support is noted at 0.5885, 0.5866, 0.5843
- Pivot resistance is noted at 0.5927, 0.595, 0.5969
| Levels | Levels.1 |
|---|---|
| Previous Daily High | 0.5931 |
| Previous Daily Low | 0.5889 |
| Previous Weekly High | 0.5961 |
| Previous Weekly Low | 0.5847 |
| Previous Monthly High | 0.6219 |
| Previous Monthly Low | 0.5885 |
| Daily Fibonacci 38.2% | 0.5905 |
| Daily Fibonacci 61.8% | 0.5915 |
| Daily Pivot Point S1 | 0.5885 |
| Daily Pivot Point S2 | 0.5866 |
| Daily Pivot Point S3 | 0.5843 |
| Daily Pivot Point R1 | 0.5927 |
| Daily Pivot Point R2 | 0.5950 |
| Daily Pivot Point R3 | 0.5969 |
[/s2If]
Download Nehcap EAWe have two EAs that are operational on our LIVE accounts.
- EA-FIX: Check out the details here. Download EA-FIX . EA-FIX is a non-grid HFT scalper.
- EA-GROWTH: High quality low dd EA using trend grids. Download EA_GROWTHJoin Our Telegram Group
")


