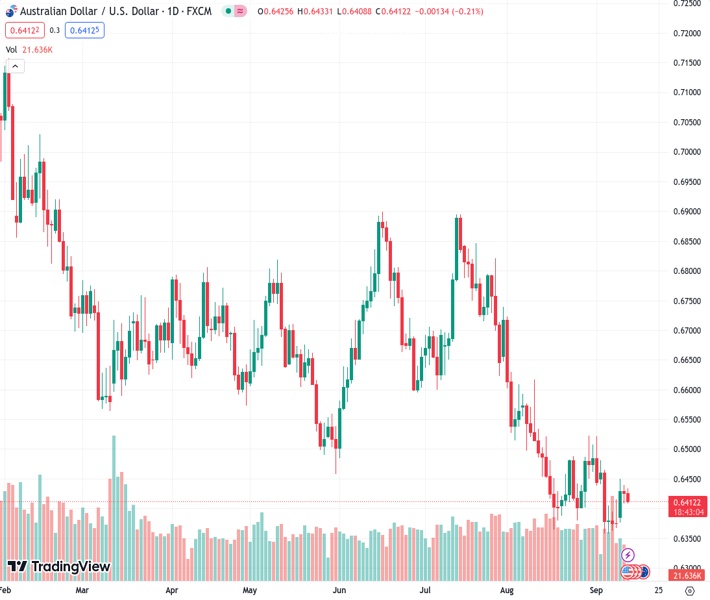
The AUDUSD pair, currently trading at 0.64105, fluctuates within a small margin near 0.6418, experiencing a loss of 0.12% during the day.
…
This is a premium post.
[s2If !current_user_can(access_s2member_level4)]Please register for FREE REGISTER to read full post below containing analysis. In case of any error or you think you are not able to read the full post below, please email us at support#nehcap.com [lwa][/s2If] [s2If current_user_can(access_s2member_level1)]
- AUD/USD oscillates in a narrow range around 0.6418, losing 0.12% on the day.
The pair currently trades last at 0.64105.
The previous day high was 0.644 while the previous day low was 0.6408. The daily 38.2% Fib levels comes at 0.642, expected to provide resistance. Similarly, the daily 61.8% fib level is at 0.6428, expected to provide resistance.
The AUD/USD pair remains confined around the 0.6410-0.6427 region in a narrow trading band during the Asian trading hours on Wednesday. The release of the US Consumer Price Index (CPI) on Wednesday and Australian employment data on Thursday could trigger volatility in the market.
Meanwhile, the Aussie (AUD) is capped by the downbeat Australian data. Data released on Tuesday reported that Australia’s Westpac Consumer Confidence for September fell by 1.5% to 79.7, following a 0.4% drop In the previous reading. The figure has remained below 100, the longest period since the early 1990s recession, and fueled concern about the impact of the economic slowdown in China.
From the technical perspective, the AUD/USD pair trades above the 50- and 100-hour Exponential Moving Averages (EMAs) on the one-hour chart, indicating that the path of least resistance for the pair is to the upside.
The immediate resistance level for AUD/USD is seen near the upper boundary of the Bollinger Band at 0.6432. Further north, the 0.6500-0.6505 regions appear a tough nut to crack for Aussie bears. The mentioned level represents the confluence of a psychological round mark and a high of August 14. Any meaningful follow-through buying above the latter could pave the way to 0.6522 (high of August 15) and 0.6570 (high of August 9).
On the flip side, the key support level is located at the 0.6400-0.6410 region, representing the lower limit of the Bollinger Band, 100-hour EMA, and a psychological round figure. A decisive breach of the latter will see the next stop at 0.6380 (low of August 25) and finally at 0.6365 (low of August 17).
It’s worth noting that the Relative Strength Index (RSI) stands in bearish territory below 50, challenging the pair’s immediate downside for the time being.
Technical Levels: Supports and Resistances
AUDUSD currently trading at 0.6418 at the time of writing. Pair opened at 0.6426 and is trading with a change of -0.12 % .
| Overview | Overview.1 | |
|---|---|---|
| 0 | Today last price | 0.6418 |
| 1 | Today Daily Change | -0.0008 |
| 2 | Today Daily Change % | -0.1200 |
| 3 | Today daily open | 0.6426 |
The pair remains strongly bearish on the daily time frame. It trades below the 20 SMA @ 0.6427, 50 SMA 0.6571, 100 SMA @ 0.6622 and 200 SMA @ 0.671.
| Trends | Trends.1 | |
|---|---|---|
| 0 | Daily SMA20 | 0.6427 |
| 1 | Daily SMA50 | 0.6571 |
| 2 | Daily SMA100 | 0.6622 |
| 3 | Daily SMA200 | 0.6710 |
The previous day high was 0.644 while the previous day low was 0.6408. The daily 38.2% Fib levels comes at 0.642, expected to provide resistance. Similarly, the daily 61.8% fib level is at 0.6428, expected to provide resistance.
Note the levels of interest below:
- Pivot support is noted at 0.641, 0.6393, 0.6378
- Pivot resistance is noted at 0.6441, 0.6456, 0.6472
| Levels | Levels.1 |
|---|---|
| Previous Daily High | 0.6440 |
| Previous Daily Low | 0.6408 |
| Previous Weekly High | 0.6480 |
| Previous Weekly Low | 0.6357 |
| Previous Monthly High | 0.6724 |
| Previous Monthly Low | 0.6364 |
| Daily Fibonacci 38.2% | 0.6420 |
| Daily Fibonacci 61.8% | 0.6428 |
| Daily Pivot Point S1 | 0.6410 |
| Daily Pivot Point S2 | 0.6393 |
| Daily Pivot Point S3 | 0.6378 |
| Daily Pivot Point R1 | 0.6441 |
| Daily Pivot Point R2 | 0.6456 |
| Daily Pivot Point R3 | 0.6472 |
[/s2If]
Download Nehcap EAWe have two EAs that are operational on our LIVE accounts.
- EA-FIX: Check out the details here. Download EA-FIX . EA-FIX is a non-grid HFT scalper.
- EA-GROWTH: High quality low dd EA using trend grids. Download EA_GROWTHJoin Our Telegram Group
")


