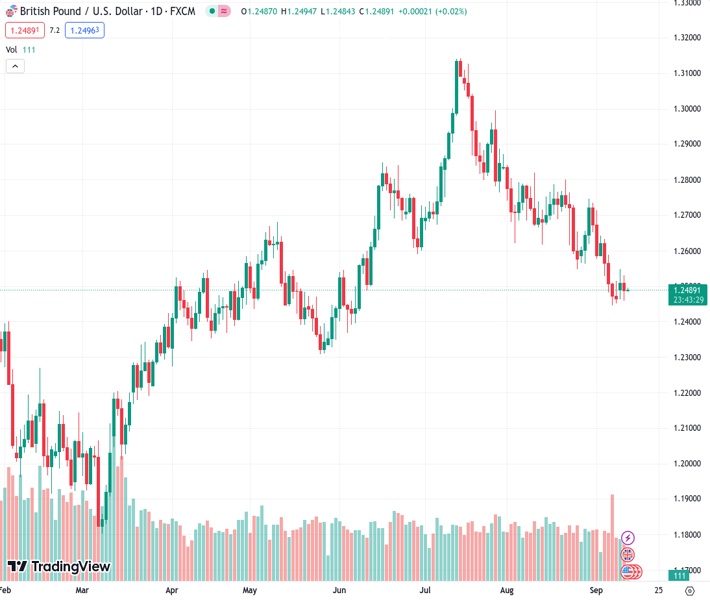
The value of the GBPUSD currency pair, which was at 1.24890, dropped close to 1.2490 and experienced losses in five of the past six days.
…
This is a premium post.
[s2If !current_user_can(access_s2member_level4)]Please register for FREE REGISTER to read full post below containing analysis. In case of any error or you think you are not able to read the full post below, please email us at support#nehcap.com [lwa][/s2If] [s2If current_user_can(access_s2member_level1)]
- GBP/USD declined towards 1.2490 and saw losses in five out of the last six days.
The pair currently trades last at 1.24890.
The previous day high was 1.2548 while the previous day low was 1.2466. The daily 38.2% Fib levels comes at 1.2517, expected to provide resistance. Similarly, the daily 61.8% fib level is at 1.2498, expected to provide resistance.
In Tuesday’s session, the GBP/USD fell below the 1.2500 area near 1.2490, seeing nearly 0.14% losses. The main downward driver of the Cable is investors placing dovish bets on the Bank of England (BoE) and the Greenback recovering ground, and markets remain cautious ahead of inflation figures from the US from August.
The UK reported weak labour market data on Wednesday’s European session. The Unemployment rate in the three months ending in July rose to 4.3%, as expected, while the Employment Change figure declined by 207,000, higher than the 185,000 expected in July. In addition, wage inflation measured by the Average Earnings in the three months up to July rose to 8.5% YoY, vs. the 8.2% expected, and while inflation rose as well as unemployment, it is not good news for the UK’s economy.
According to the World Interest Rate Probabilities tool (WIRP), markets are now discounting higher odds of a hike in the September and February meetings, which would lift the target rate to 5.75%.
On the other hand, the US’s calendar had nothing relevant to offer that its drivers on the session where investors seeking refuge in the Greenback ahead of the release of the Consumer Price Index (CPI) data from the US from August on Wednesday. The headline and core figure are expected to have accelerated on a monthly basis, and hot reading may boost hawkish bets on the Federal Reserve (Fed), which could open the upside for the USD.
The daily chart analysis indicates a bearish outlook for the GBP/USD in the short term. The Relative Strength Index (RSI) is below its midline in negative territory, with a negative slope, aligning with the negative signal from the Moving Average Convergence Divergence (MACD), which displays red bars, reinforcing the strong bearish sentiment. Additionally, the pair is below the 20 and 100-day Simple Moving Averages (SMAs) but above the 200-day SMA, suggesting that despite the recent bearish sentiment, the bulls are still resilient, holding some momentum.
That being said, if the Cable loses the 200-day SMA at 1.2428, it would exacerbate the bearish momentum with the next targets at 1.2400 and 1.23800. On the upside, resistances line up at 1.2500, 1.2540 and 1.2570.
Technical Levels: Supports and Resistances
GBPUSD currently trading at 1.2493 at the time of writing. Pair opened at 1.251 and is trading with a change of -0.14 % .
| Overview | Overview.1 | |
|---|---|---|
| 0 | Today last price | 1.2493 |
| 1 | Today Daily Change | -0.0017 |
| 2 | Today Daily Change % | -0.1400 |
| 3 | Today daily open | 1.2510 |
The pair is trading below its 20 Daily moving average @ 1.2635, below its 50 Daily moving average @ 1.2757 , below its 100 Daily moving average @ 1.2655 and above its 200 Daily moving average @ 1.2428
| Trends | Trends.1 | |
|---|---|---|
| 0 | Daily SMA20 | 1.2635 |
| 1 | Daily SMA50 | 1.2757 |
| 2 | Daily SMA100 | 1.2655 |
| 3 | Daily SMA200 | 1.2428 |
The previous day high was 1.2548 while the previous day low was 1.2466. The daily 38.2% Fib levels comes at 1.2517, expected to provide resistance. Similarly, the daily 61.8% fib level is at 1.2498, expected to provide resistance.
Note the levels of interest below:
- Pivot support is noted at 1.2468, 1.2426, 1.2386
- Pivot resistance is noted at 1.255, 1.259, 1.2633
| Levels | Levels.1 |
|---|---|
| Previous Daily High | 1.2548 |
| Previous Daily Low | 1.2466 |
| Previous Weekly High | 1.2643 |
| Previous Weekly Low | 1.2446 |
| Previous Monthly High | 1.2841 |
| Previous Monthly Low | 1.2548 |
| Daily Fibonacci 38.2% | 1.2517 |
| Daily Fibonacci 61.8% | 1.2498 |
| Daily Pivot Point S1 | 1.2468 |
| Daily Pivot Point S2 | 1.2426 |
| Daily Pivot Point S3 | 1.2386 |
| Daily Pivot Point R1 | 1.2550 |
| Daily Pivot Point R2 | 1.2590 |
| Daily Pivot Point R3 | 1.2633 |
[/s2If]
Download Nehcap EAWe have two EAs that are operational on our LIVE accounts.
- EA-FIX: Check out the details here. Download EA-FIX . EA-FIX is a non-grid HFT scalper.
- EA-GROWTH: High quality low dd EA using trend grids. Download EA_GROWTHJoin Our Telegram Group
")


