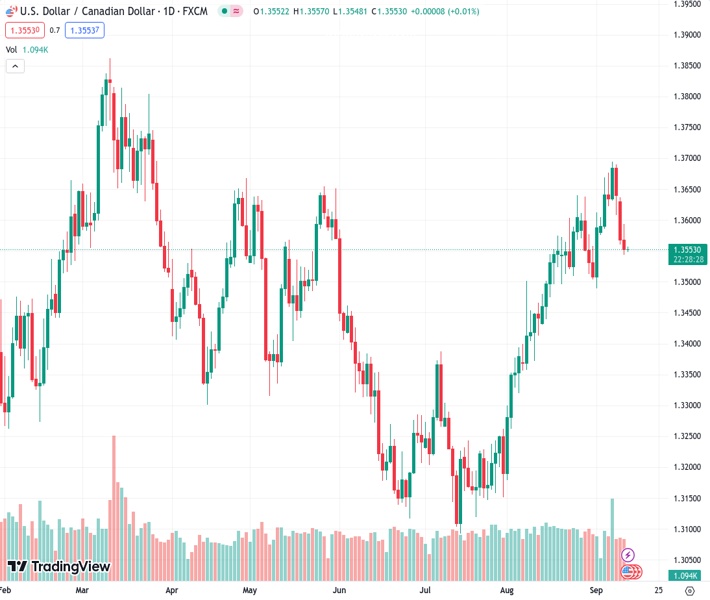
The USDCAD pair, currently at 1.35537, is trading at almost the same level with minor movement at 1.3552. This stability is due to the positive impact of high oil prices counterbalancing small gains in the US Dollar Index (DXY).
…
This is a premium post.
[s2If !current_user_can(access_s2member_level4)]Please register for FREE REGISTER to read full post below containing analysis. In case of any error or you think you are not able to read the full post below, please email us at support#nehcap.com [lwa][/s2If] [s2If current_user_can(access_s2member_level1)]
- USD/CAD trades nearly flat at 1.3552, as high oil prices offset minor gains in the US Dollar Index (DXY).
The pair currently trades last at 1.35537.
The previous day high was 1.3639 while the previous day low was 1.3561. The daily 38.2% Fib levels comes at 1.3591, expected to provide resistance. Similarly, the daily 61.8% fib level is at 1.3609, expected to provide resistance.
The Canadian Dollar (CAD) dropped on Tuesday’s session against the US Dollar (USD), underpinned by high oil prices, amid the lack of catalyst in the financial markets. With traders bracing for the August US inflation report, we could expect the USD/CAD to trade within a choppy trading range. The USD/CAD is trading at 1.3552, almost unchanged.
On Wednesday, the US Bureau of Labor Statistics (BLS) will reveal the US Consumer Price Index (CPI) report, which is expected to climb above the prior month’s figure. The CPI is estimated at 3.6% YoY, above July’s 3.2%. Excluding volatile items, the so-called core CPI is foreseen at 4.3% YoY, down from July 4.7%.
Even though the Greenback recovered some ground against a basket of six currencies, the US Dollar Index (DXY) finished with minuscule gains of 0.01%, at 104.54. In addition, it failed to bolster the USD/CAD pair, as oil prices finished with gains of more than 1.70%.
Up north across the US border, Canada’s economy has shown mixed data. Although the second quarter Gross Domestic Product (GDP) sounded the alarms of a recession, the latest employment report suggests the economy remains robust.
That triggered a reaction by the Bank of Canada (BoC), who decided to sit on their hands, awaiting more data, before committing to keep rates on hold or opening the door for additional tightening. Interest rate probabilities show the BoC is expected to hold rates at 5% for the upcoming meeting in October 25.
Nevertheless, Tiff Macklem, the BoC’s Governor, stressed that interest rates may not be high enough to tame inflation. He added, “Going forward, we will look for further evidence that price pressures are easing.”
Given the backdrop, if US inflation decelerates in both readings, USD/CAD traders could expect further downside, with sellers eyeing a test of the 200-DMA. Otherwise, speculations the US Federal Reserve would continue to tighten monetary conditions could pave the way for buyers to reclaim 1.3600.
After extending its losses for three straight days, the USD/CAD has fallen from around 1.3600 towards the 1.3550s area, closing near the day’s lows. Therefore, the USD/CAD path of least resistance is downwards and will face first support at the current week’s low of 1.3543. Once cleared, the pair could dive to the 1.3500 figure, followed by the 200-day Moving Average (DMA( at 1.3464. On the flip side, the USD/CAD could shift upwards if the pair stages a comeback toward the September 11 high at 1.3593.
Technical Levels: Supports and Resistances
USDCAD currently trading at 1.3554 at the time of writing. Pair opened at 1.3572 and is trading with a change of -0.13 % .
| Overview | Overview.1 | |
|---|---|---|
| 0 | Today last price | 1.3554 |
| 1 | Today Daily Change | -0.0018 |
| 2 | Today Daily Change % | -0.1300 |
| 3 | Today daily open | 1.3572 |
The pair is trading below its 20 Daily moving average @ 1.3574, above its 50 Daily moving average @ 1.3394 , above its 100 Daily moving average @ 1.3406 and above its 200 Daily moving average @ 1.3467
| Trends | Trends.1 | |
|---|---|---|
| 0 | Daily SMA20 | 1.3574 |
| 1 | Daily SMA50 | 1.3394 |
| 2 | Daily SMA100 | 1.3406 |
| 3 | Daily SMA200 | 1.3467 |
The previous day high was 1.3639 while the previous day low was 1.3561. The daily 38.2% Fib levels comes at 1.3591, expected to provide resistance. Similarly, the daily 61.8% fib level is at 1.3609, expected to provide resistance.
Note the levels of interest below:
- Pivot support is noted at 1.3542, 1.3513, 1.3465
- Pivot resistance is noted at 1.362, 1.3669, 1.3698
| Levels | Levels.1 |
|---|---|
| Previous Daily High | 1.3639 |
| Previous Daily Low | 1.3561 |
| Previous Weekly High | 1.3694 |
| Previous Weekly Low | 1.3576 |
| Previous Monthly High | 1.3640 |
| Previous Monthly Low | 1.3184 |
| Daily Fibonacci 38.2% | 1.3591 |
| Daily Fibonacci 61.8% | 1.3609 |
| Daily Pivot Point S1 | 1.3542 |
| Daily Pivot Point S2 | 1.3513 |
| Daily Pivot Point S3 | 1.3465 |
| Daily Pivot Point R1 | 1.3620 |
| Daily Pivot Point R2 | 1.3669 |
| Daily Pivot Point R3 | 1.3698 |
[/s2If]
Download Nehcap EAWe have two EAs that are operational on our LIVE accounts.
- EA-FIX: Check out the details here. Download EA-FIX . EA-FIX is a non-grid HFT scalper.
- EA-GROWTH: High quality low dd EA using trend grids. Download EA_GROWTHJoin Our Telegram Group
")


