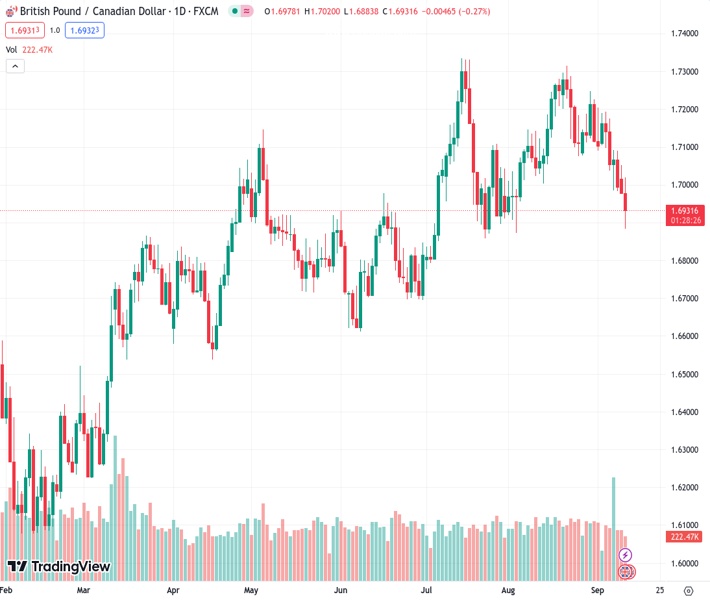
The currency pair GBPCAD, which was valued at 1.69326, is currently being traded at 1.6924. This decrease in value is attributed to the influence of increasing oil prices and a rise in the UK unemployment rate to 4.3%.
…
This is a premium post.
[s2If !current_user_can(access_s2member_level4)]Please register for FREE REGISTER to read full post below containing analysis. In case of any error or you think you are not able to read the full post below, please email us at support#nehcap.com [lwa][/s2If] [s2If current_user_can(access_s2member_level1)]
- GBP/CAD trades at 1.6924, pressured by rising oil prices and a UK unemployment rate increase to 4.3%.
The pair currently trades last at 1.69326.
The previous day high was 1.7053 while the previous day low was 1.6975. The daily 38.2% Fib levels comes at 1.7005, expected to provide resistance. Similarly, the daily 61.8% fib level is at 1.7023, expected to provide resistance.
The Loonie (CAD) extends its gains against the Pound Sterling (GBP) due to increasing oil prices and mixed UK economic data. Hence, the GBP/CAD is trading at 1.6924 after hitting a daily high of 1.7020.
During the European session, the Office for National Statistics (ONS) in the UK revealed the Unemployment Rate climbed to 4.3% in the three months to July, above the prior month’s 4.2%, while wages excluding bonuses grew by 7.8%, as expected, unchanged to the last reading.
Although the labor market is cooling, as the UK economy feels the impact of higher interest rates imposed by the Bank of England (BoE), higher wages suggest the central bank’s job isn’t done. The BoE’s expectations for another rate hike remained below last week’s estimates, which foresaw the bank rate to end at around 5.73%. Nevertheless, the latest data round suggests that Bailey and Co would refrain from exceeding the 5.50% threshold.
On the Canadian front, as the economy added more jobs than expected, as revealed last week, it has opened the door for additional tightening by the Bank of Canada (BoC). The BoC has expressed that people demanding higher wages would make it harder to curb stickier inflation.
The latest BoC monetary decisions witnessed the BoC keeping rates unchanged at 5%. But the chances for additional tightening remain, as money market futures show 15 bps of further tightening for BoC’s June 2024 monetary policy decision.
In his latest remarks last Thursday, Tiff Macklem, the BoC’s Governor, stressed that interest rates may not be high enough to tame inflation. He added, “Going forward, we will look for further evidence that price pressures are easing.”
Given the fundamental backdrop, the GBP/CAD could consolidate ahead of the upcoming monetary policy decisions in the near term. Nevertheless, higher oil prices could offset the interest rate differential in favor of the Pound Sterling (GBP) and open the door for further weakness in the cross-currency pair.
The daily chart depicts the pai as neutral to downward biased, despite the fact the GBP/CAD remains above the 200-day Moving Average (DMA). However, successive series of lower peaks and throughs suggest the cross would test the 1.6900 figure. A breach of the latter would expose the July 24 daily low of 1.6883, followed by the 200-DMA at 1.6729. Conversely, if buyers reclaim the 100-DMA at 1.6958, that could pave the way towards 1.7000.
Technical Levels: Supports and Resistances
GBPCAD currently trading at 1.6931 at the time of writing. Pair opened at 1.6975 and is trading with a change of -0.26 % .
| Overview | Overview.1 | |
|---|---|---|
| 0 | Today last price | 1.6931 |
| 1 | Today Daily Change | -0.0044 |
| 2 | Today Daily Change % | -0.2600 |
| 3 | Today daily open | 1.6975 |
The pair is trading below its 20 Daily moving average @ 1.715, below its 50 Daily moving average @ 1.7087 , below its 100 Daily moving average @ 1.6963 and above its 200 Daily moving average @ 1.6734
| Trends | Trends.1 | |
|---|---|---|
| 0 | Daily SMA20 | 1.7150 |
| 1 | Daily SMA50 | 1.7087 |
| 2 | Daily SMA100 | 1.6963 |
| 3 | Daily SMA200 | 1.6734 |
The previous day high was 1.7053 while the previous day low was 1.6975. The daily 38.2% Fib levels comes at 1.7005, expected to provide resistance. Similarly, the daily 61.8% fib level is at 1.7023, expected to provide resistance.
Note the levels of interest below:
- Pivot support is noted at 1.6949, 1.6923, 1.6872
- Pivot resistance is noted at 1.7027, 1.7079, 1.7105
| Levels | Levels.1 |
|---|---|
| Previous Daily High | 1.7053 |
| Previous Daily Low | 1.6975 |
| Previous Weekly High | 1.7194 |
| Previous Weekly Low | 1.6980 |
| Previous Monthly High | 1.7625 |
| Previous Monthly Low | 1.6476 |
| Daily Fibonacci 38.2% | 1.7005 |
| Daily Fibonacci 61.8% | 1.7023 |
| Daily Pivot Point S1 | 1.6949 |
| Daily Pivot Point S2 | 1.6923 |
| Daily Pivot Point S3 | 1.6872 |
| Daily Pivot Point R1 | 1.7027 |
| Daily Pivot Point R2 | 1.7079 |
| Daily Pivot Point R3 | 1.7105 |
[/s2If]
Download Nehcap EAWe have two EAs that are operational on our LIVE accounts.
- EA-FIX: Check out the details here. Download EA-FIX . EA-FIX is a non-grid HFT scalper.
- EA-GROWTH: High quality low dd EA using trend grids. Download EA_GROWTHJoin Our Telegram Group
")


