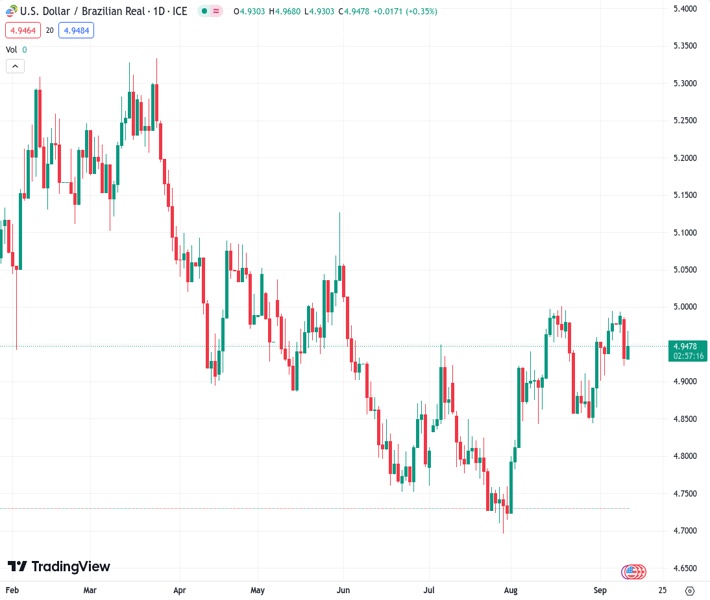
The Brazilian real, represented by the USD/BRL currency pair, initially increased to approximately 4.9680 and later stabilized at 4.9450.
…
This is a premium post.
[s2If !current_user_can(access_s2member_level4)]Please register for FREE REGISTER to read full post below containing analysis. In case of any error or you think you are not able to read the full post below, please email us at support#nehcap.com [lwa][/s2If] [s2If current_user_can(access_s2member_level1)]
- USD/BRL rose to a high near 4.9680 and then settled at 4.9450.
The pair currently trades last at 4.94880.
The previous day high was 4.9871 while the previous day low was 4.9211. The daily 38.2% Fib levels comes at 4.9463, expected to provide support. Similarly, the daily 61.8% fib level is at 4.9619, expected to provide resistance.
The USD/BRL gathered momentum in Tuesday’s session after the BRL decline after the release of the Brazilian inflation figures from August. On the USD side, it is recovering ground after trading soft on Monday while markets seem cautious ahead of Wednesday’s inflation readings from the US.
The Instituto Brasileiro de Geografia e Estatistica revealed that the IPCA inflation advanced 0.23% MoM and matched expectations.
Recent upward movements of the pair may be attributed to recent rate cuts by the Bank of Brazil’s Monetary Policy Committee (COPOM), and markets are expecting the bank to cut further the target rate next week by 50 basis points to 12.75% which could exacerbate the downside for the Brazilian currency.
On the other hand, the USD is trading firm against its rivals, driven by a cautious market mood and US Treasury yields remaining high. That being said, Wednesday’s Consumer Price Index (CPI) figures will be crucial for the Greenback’s and bond price dynamics as they will play a big rol in modelling expectations of the next Federal Reserve (Fed) decisions. As for now, a pause in next week’s meeting is practically priced in while there’s still a 40% chance of one last interest rate hike in either December or November, according to the World Interest Rate Probabilities tool.
Observing the daily chart, USD/BRL displays a neutral to bullish technical outlook for the short term as the bulls gain momentum. The Relative Strength Index (RSI) demonstrates a favourable upward trend above its midline, while the Moving Average Convergence (MACD) shows stagnant red bars. Additionally, the pair is above the 20 and 100-day Simple Moving Averages (SMAs), but below the 200-day SMA, suggesting that the bulls are in command over the bears on the bigger picture.
Support levels: 4.9350 (20-day SMA), 4.9330, 4.9150.
Resistance levels: 4.9680, 4.9840, 4.9900.
Technical Levels: Supports and Resistances
USDBRL currently trading at 4.9451 at the time of writing. Pair opened at 4.9311 and is trading with a change of 0.28 % .
| Overview | Overview.1 | |
|---|---|---|
| 0 | Today last price | 4.9451 |
| 1 | Today Daily Change | 0.0140 |
| 2 | Today Daily Change % | 0.2800 |
| 3 | Today daily open | 4.9311 |
The pair is trading above its 20 Daily moving average @ 4.9378, above its 50 Daily moving average @ 4.8734 , above its 100 Daily moving average @ 4.8975 and below its 200 Daily moving average @ 5.0359
| Trends | Trends.1 | |
|---|---|---|
| 0 | Daily SMA20 | 4.9378 |
| 1 | Daily SMA50 | 4.8734 |
| 2 | Daily SMA100 | 4.8975 |
| 3 | Daily SMA200 | 5.0359 |
The previous day high was 4.9871 while the previous day low was 4.9211. The daily 38.2% Fib levels comes at 4.9463, expected to provide support. Similarly, the daily 61.8% fib level is at 4.9619, expected to provide resistance.
Note the levels of interest below:
- Pivot support is noted at 4.9058, 4.8804, 4.8398
- Pivot resistance is noted at 4.9718, 5.0124, 5.0378
| Levels | Levels.1 |
|---|---|
| Previous Daily High | 4.9871 |
| Previous Daily Low | 4.9211 |
| Previous Weekly High | 4.9950 |
| Previous Weekly Low | 4.9072 |
| Previous Monthly High | 4.9981 |
| Previous Monthly Low | 4.7239 |
| Daily Fibonacci 38.2% | 4.9463 |
| Daily Fibonacci 61.8% | 4.9619 |
| Daily Pivot Point S1 | 4.9058 |
| Daily Pivot Point S2 | 4.8804 |
| Daily Pivot Point S3 | 4.8398 |
| Daily Pivot Point R1 | 4.9718 |
| Daily Pivot Point R2 | 5.0124 |
| Daily Pivot Point R3 | 5.0378 |
[/s2If]
Download Nehcap EAWe have two EAs that are operational on our LIVE accounts.
- EA-FIX: Check out the details here. Download EA-FIX . EA-FIX is a non-grid HFT scalper.
- EA-GROWTH: High quality low dd EA using trend grids. Download EA_GROWTHJoin Our Telegram Group
")


