USDCAD at 1.36257 is finding it difficult to recover from the losses it suffered in the previous session due to the weak US dollar.
…
This is a premium post.
[s2If !current_user_can(access_s2member_level4)]Please register for FREE REGISTER to read full post below containing analysis. In case of any error or you think you are not able to read the full post below, please email us at support#nehcap.com [lwa][/s2If] [s2If current_user_can(access_s2member_level1)]
- USD/CAD struggles to snap the previous session’s losses on the back of a soft Greenback.
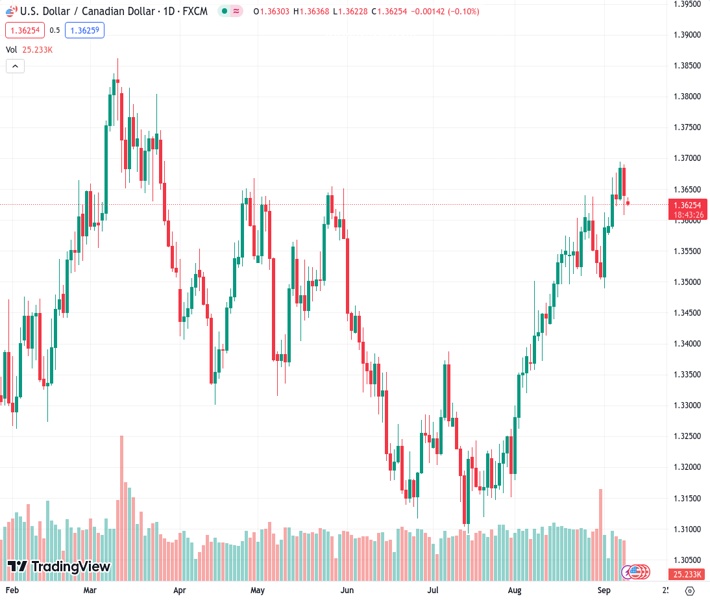
The pair currently trades last at 1.36257.
The previous day high was 1.369 while the previous day low was 1.3608. The daily 38.2% Fib levels comes at 1.3639, expected to provide resistance. Similarly, the daily 61.8% fib level is at 1.3659, expected to provide resistance.
USD/CAD hovers around 1.3630 during the Asian session on Monday, attempting to snap the previous session’s losses. The pair experienced downward pressure despite the upbeat employment data for August from Canada on Friday.
As said, Average Hourly Wages (YoY) improved to 5.2% from the previous reading of 5.0%. Net Change in Employment (Aug) printed a reading of 39.9K, significantly higher than the market consensus of 15.0K, swinging from the previous -6.4K. While the Unemployment Rate remained consistent at 5.5% against the expectations of a 5.6% reading.
However, strong wage growth has the potential to boost consumer spending and maintain persistent inflationary pressures. This situation might lead the Bank of Canada (BoC) to consider raising interest rates once more.
US Dollar Index (DXY), which measures the performance of the Greenback against six other major currencies, is presently trading around 104.80 slightly below its peak since April. However, US Treasury yields have improved, which could exert pressure on the price of the yellow metal. The yields on 10-year US Treasury bonds rose to 4.29%, up by 0.52%.
US dollar (USD) is anticipated to maintain its strength, supported by the continuous stream of positive economic data reflecting the robust state of the US economy. For instance, US Initial Jobless Claims recently reported a figure of 216K for the week ending September 2, which was below market expectations of 234K and lower than the previous week’s revised figure of 229K. This positive labor data contributes to the resilience of the US dollar.
Additionally, Chicago Fed Bank President Austan Goolsbee has articulated the central bank’s objective of steering the economy onto a “golden path.” This path signifies a scenario in which inflation subsides without causing a recession, a delicate balance that central banks often strive to achieve to maintain economic stability and growth.
Moreover, investors are seeking further cues on the US Federal Reserve’s (Fed) decision on maintaining higher interest rates for an extended duration. Also, traders anticipate that the Fed will implement a 25 basis point (bps) interest rate hike by the conclusion of the year 2023. This hawkish stance from the central bank could potentially contribute to the support in underpinning the Greenback.
Given the lack of significant economic data releases from Canada, investors are likely to turn their attention to the United States (US) Consumer Price Index (CPI) for August, scheduled for release on Wednesday. This data is expected to provide valuable insights into the inflation scenario and could influence investor decisions regarding the USD/CAD pair, potentially prompting fresh trading positions.
Technical Levels: Supports and Resistances
USDCAD currently trading at 1.3626 at the time of writing. Pair opened at 1.3639 and is trading with a change of -0.1 % .
| Overview | Overview.1 | |
|---|---|---|
| 0 | Today last price | 1.3626 |
| 1 | Today Daily Change | -0.0013 |
| 2 | Today Daily Change % | -0.1000 |
| 3 | Today daily open | 1.3639 |
The pair remains strongly bullish on the daily timeframe. It trades above its 20 SMA @ 1.3569, 50 SMA 1.3388, 100 SMA @ 1.3405 and 200 SMA @ 1.3467.
| Trends | Trends.1 | |
|---|---|---|
| 0 | Daily SMA20 | 1.3569 |
| 1 | Daily SMA50 | 1.3388 |
| 2 | Daily SMA100 | 1.3405 |
| 3 | Daily SMA200 | 1.3467 |
The previous day high was 1.369 while the previous day low was 1.3608. The daily 38.2% Fib levels comes at 1.3639, expected to provide resistance. Similarly, the daily 61.8% fib level is at 1.3659, expected to provide resistance.
Note the levels of interest below:
- Pivot support is noted at 1.3601, 1.3564, 1.352
- Pivot resistance is noted at 1.3683, 1.3727, 1.3765
| Levels | Levels.1 |
|---|---|
| Previous Daily High | 1.3690 |
| Previous Daily Low | 1.3608 |
| Previous Weekly High | 1.3694 |
| Previous Weekly Low | 1.3576 |
| Previous Monthly High | 1.3640 |
| Previous Monthly Low | 1.3184 |
| Daily Fibonacci 38.2% | 1.3639 |
| Daily Fibonacci 61.8% | 1.3659 |
| Daily Pivot Point S1 | 1.3601 |
| Daily Pivot Point S2 | 1.3564 |
| Daily Pivot Point S3 | 1.3520 |
| Daily Pivot Point R1 | 1.3683 |
| Daily Pivot Point R2 | 1.3727 |
| Daily Pivot Point R3 | 1.3765 |
[/s2If]
Download Nehcap EAWe have two EAs that are operational on our LIVE accounts.
- EA-FIX: Check out the details here. Download EA-FIX . EA-FIX is a non-grid HFT scalper.
- EA-GROWTH: High quality low dd EA using trend grids. Download EA_GROWTHJoin Our Telegram Group
")


