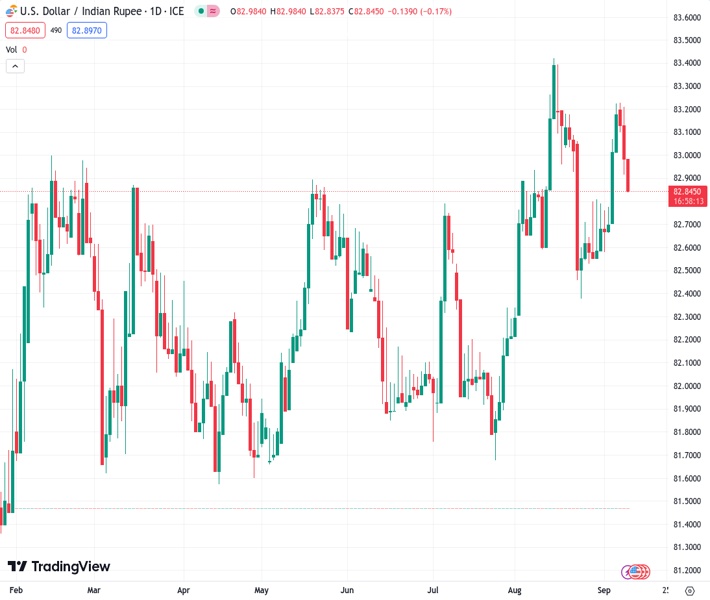
The USD to INR exchange rate has continued to fall for the third consecutive day, reaching 82.8640. This decline is largely due to expectations of a more accommodative monetary policy from the Federal Reserve in September.
…
This is a premium post.
[s2If !current_user_can(access_s2member_level4)]Please register for FREE REGISTER to read full post below containing analysis. In case of any error or you think you are not able to read the full post below, please email us at support#nehcap.com [lwa][/s2If] [s2If current_user_can(access_s2member_level1)]
- USD/INR extends its losses on the third day, driven by the anticipation of a dovish Fed policy in September.
The pair currently trades last at 82.8640.
The previous day high was 83.2676 while the previous day low was 82.911. The daily 38.2% Fib levels comes at 83.0472, expected to provide resistance. Similarly, the daily 61.8% fib level is at 83.1313, expected to provide resistance.
USD/INR trades lower around 82.80 during the Asian session on Monday, extending losses for the third successive day. The pair faces downward pressure because the likelihood of the US Federal Reserve (Fed) keeping interest rates unchanged in the upcoming September meeting increased.
Additionally, the continuous rise in the Gift Nifty is contributing support to underpin the Indian Rupee (INR). The dollar-denominated futures contract based on the Nifty 50 index, trades higher around 19985.0. Moreover, investors will closely monitor the response of the Reserve Bank of India (RBI) to potential volatility. The central bank’s actions and statements can have a significant impact on market stability and investor confidence.
However, the Fed is expected to sustain elevated interest rates over an extended period. Also, traders are expecting that the Fed may enact a 25 basis point (bps) interest rate hike by the end of 2023. This hawkish stance taken by the central bank could potentially provide further support for the USD/INR pair.
US Dollar Index (DXY), which compares the performance of US Dollar (USD) against six other major currencies, trades lower around 104.70. However, Improved US Treasury yields could provide support to the strength of the Greenback. The yields on 10-year US Treasury bonds rose to 4.29%, up by 0.70% at the time of writing.
Moreover, US Initial Jobless Claims data for the week ending September 2 showed a figure of 216K, better than the market expectations of 234K and coming in lower than the revised figure of 229K from the previous week. This favorable labor market data could play a role in shoring up the resilience of the US dollar.
Following her attendance at the G20 Summit, US Treasury Secretary Janet Yellen conveyed an increasing level of confidence in the United States’ ability to handle inflation without causing significant harm to the job market. Yellen also noted, “Every measure of inflation is on the road down,” suggesting an expectation for a decline in various inflation indicators.
Chicago Fed Bank President Austan Goolsbee has articulated the objective of the US Federal Reserve (Fed) to guide the economy onto a “golden path.” This path represents a situation in which inflation decreases without triggering a recession, a challenging equilibrium that central banks frequently aim for to sustain economic stability and growth.
Investors will likely monitor the upcoming data of the Consumer Price Index (CPI) for August from both the US and India, scheduled to be released later in the week. These datasets are expected to provide valuable insights into the inflation scenarios of both economies and could influence investor decisions regarding the USD/INR pair.
Technical Levels: Supports and Resistances
USDINR currently trading at 82.8474 at the time of writing. Pair opened at 83.046 and is trading with a change of -0.24 % .
| Overview | Overview.1 | |
|---|---|---|
| 0 | Today last price | 82.8474 |
| 1 | Today Daily Change | -0.1986 |
| 2 | Today Daily Change % | -0.2400 |
| 3 | Today daily open | 83.0460 |
The pair is trading below its 20 Daily moving average @ 82.9596, above its 50 Daily moving average @ 82.6081 , above its 100 Daily moving average @ 82.4052 and above its 200 Daily moving average @ 82.3297
| Trends | Trends.1 | |
|---|---|---|
| 0 | Daily SMA20 | 82.9596 |
| 1 | Daily SMA50 | 82.6081 |
| 2 | Daily SMA100 | 82.4052 |
| 3 | Daily SMA200 | 82.3297 |
The previous day high was 83.2676 while the previous day low was 82.911. The daily 38.2% Fib levels comes at 83.0472, expected to provide resistance. Similarly, the daily 61.8% fib level is at 83.1313, expected to provide resistance.
Note the levels of interest below:
- Pivot support is noted at 82.8821, 82.7182, 82.5255
- Pivot resistance is noted at 83.2387, 83.4314, 83.5953
| Levels | Levels.1 |
|---|---|
| Previous Daily High | 83.2676 |
| Previous Daily Low | 82.9110 |
| Previous Weekly High | 83.3714 |
| Previous Weekly Low | 82.5850 |
| Previous Monthly High | 83.5505 |
| Previous Monthly Low | 82.2240 |
| Daily Fibonacci 38.2% | 83.0472 |
| Daily Fibonacci 61.8% | 83.1313 |
| Daily Pivot Point S1 | 82.8821 |
| Daily Pivot Point S2 | 82.7182 |
| Daily Pivot Point S3 | 82.5255 |
| Daily Pivot Point R1 | 83.2387 |
| Daily Pivot Point R2 | 83.4314 |
| Daily Pivot Point R3 | 83.5953 |
[/s2If]
Download Nehcap EAWe have two EAs that are operational on our LIVE accounts.
- EA-FIX: Check out the details here. Download EA-FIX . EA-FIX is a non-grid HFT scalper.
- EA-GROWTH: High quality low dd EA using trend grids. Download EA_GROWTHJoin Our Telegram Group
")


