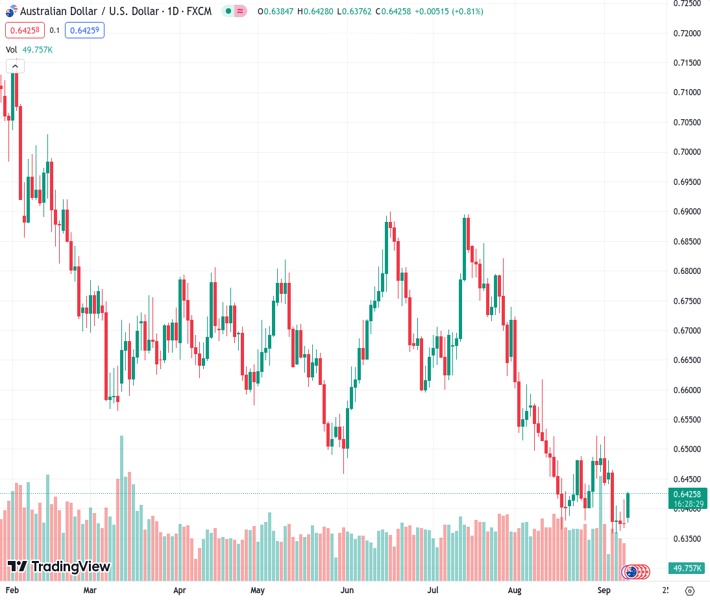
The AUDUSD pair, trading at 0.64259, is experiencing an increase in strength above the 0.6420 level due to the downward pressure on the US dollar.
…
This is a premium post.
[s2If !current_user_can(access_s2member_level4)]Please register for FREE REGISTER to read full post below containing analysis. In case of any error or you think you are not able to read the full post below, please email us at support#nehcap.com [lwa][/s2If] [s2If current_user_can(access_s2member_level1)]
- AUD/USD gains momentum above 0.6420 amid the selling pressure in USD.
The pair currently trades last at 0.64259.
The previous day high was 0.6415 while the previous day low was 0.6367. The daily 38.2% Fib levels comes at 0.6397, expected to provide support. Similarly, the daily 61.8% fib level is at 0.6385, expected to provide support.
The AUD/USD holds above the 0.6400 area during the Asian session on Monday. The uptick of the Aussie (AUD) is supported by the weakening of the US Dollar and the easing fear of China’s deflation. The pair currently trades near 0.6425, up 0.75% on the day.
After the G20 Summit, US Treasury Secretary Janet Yellen conveyed more optimism that the US could control inflation without damaging the employment market. Yellen also said on Sunday that every gauge of inflation is declining and there were no massive wave of layoffs. Chicago Fed President Austan Goolsbee outlined the central bank’s goal of leading the economy into a “golden path.” This route represents a scenario in which inflation falls without causing a recession. Furthermore, Fed New York President John Williams said last week that highlighted the decline in inflation and an improving economic balance.
According to the CME FedWatch Tool, the markets have been priced in the possibility of a 93% rate hold at the September meeting and a 43.5% chance of a rate hike at the November meeting. Adding to this, the upbeat US economic data last week lends support to the higher for longer interest rate narrative in the US. This, in turn, might lift the US Dollar (USD) and cap the upside of the AUD/USD.
At the recent policy meeting, the Reserve Bank of Australia (RBA) maintained interest rates at 4.10% for the third consecutive month. However, RBA Governor Philip Lowe warned that additional tightening may be needed to control inflation. He added in a speech that he had focused on the possibility that wages and profits could exceed levels consistent with inflation returning to target in late 2025 while mentioning that the Unemployment Rate can sustain near 40-year lows and wage growth is strong.
Additionally, Chinese inflation figures improved in August, which boosted the China-proxy New Zealand Dollar against the Greenback. The Chinese Consumer Price Index (CPI) rose 0.1% YoY, from a 0.3% drop in the previous month, compared to the 0.2% rise anticipated. The monthly figure was 0.3% as expected. Finally, the Producer Price Index (PPI) fell 3.0% YoY from 4.4% in July, in line with market consensus.
Looking ahead, the Australian Westpac Consumer Confidence for September will be due on Tuesday. Market players will shift their attention to the US Consumer Price Index (CPI) for August on Wednesday. The monthly figure is expected to rise by 0.5%, while the core monthly figure is expected to remain at 0.2%. On Thursday, Australia’s employment data and US Retail Sales will be in the spotlight. These events could trigger the volatility and give a clear direction to the AUD/USD pair.
Technical Levels: Supports and Resistances
AUDUSD currently trading at 0.6418 at the time of writing. Pair opened at 0.6378 and is trading with a change of 0.63 % .
| Overview | Overview.1 | |
|---|---|---|
| 0 | Today last price | 0.6418 |
| 1 | Today Daily Change | 0.0040 |
| 2 | Today Daily Change % | 0.6300 |
| 3 | Today daily open | 0.6378 |
The pair remains strongly bearish on the daily time frame. It trades below the 20 SMA @ 0.6431, 50 SMA 0.6581, 100 SMA @ 0.6627 and 200 SMA @ 0.6713.
| Trends | Trends.1 | |
|---|---|---|
| 0 | Daily SMA20 | 0.6431 |
| 1 | Daily SMA50 | 0.6581 |
| 2 | Daily SMA100 | 0.6627 |
| 3 | Daily SMA200 | 0.6713 |
The previous day high was 0.6415 while the previous day low was 0.6367. The daily 38.2% Fib levels comes at 0.6397, expected to provide support. Similarly, the daily 61.8% fib level is at 0.6385, expected to provide support.
Note the levels of interest below:
- Pivot support is noted at 0.6358, 0.6339, 0.6311
- Pivot resistance is noted at 0.6406, 0.6434, 0.6453
| Levels | Levels.1 |
|---|---|
| Previous Daily High | 0.6415 |
| Previous Daily Low | 0.6367 |
| Previous Weekly High | 0.6480 |
| Previous Weekly Low | 0.6357 |
| Previous Monthly High | 0.6724 |
| Previous Monthly Low | 0.6364 |
| Daily Fibonacci 38.2% | 0.6397 |
| Daily Fibonacci 61.8% | 0.6385 |
| Daily Pivot Point S1 | 0.6358 |
| Daily Pivot Point S2 | 0.6339 |
| Daily Pivot Point S3 | 0.6311 |
| Daily Pivot Point R1 | 0.6406 |
| Daily Pivot Point R2 | 0.6434 |
| Daily Pivot Point R3 | 0.6453 |
[/s2If]
Download Nehcap EAWe have two EAs that are operational on our LIVE accounts.
- EA-FIX: Check out the details here. Download EA-FIX . EA-FIX is a non-grid HFT scalper.
- EA-GROWTH: High quality low dd EA using trend grids. Download EA_GROWTHJoin Our Telegram Group
")


