The USDJPY pair has slightly moved up to 147.36 after the release of disappointing economic growth data from Japan.
…
This is a premium post.
[s2If !current_user_can(access_s2member_level4)]Please register for FREE REGISTER to read full post below containing analysis. In case of any error or you think you are not able to read the full post below, please email us at support#nehcap.com [lwa][/s2If] [s2If current_user_can(access_s2member_level1)]
- USD/JPY edges higher to 147.36 following the weaker Japanese growth numbers.
The pair currently trades last at 147.166.
The previous day high was 147.88 while the previous day low was 147.04. The daily 38.2% Fib levels comes at 147.32, expected to provide resistance. Similarly, the daily 61.8% fib level is at 147.51, expected to provide resistance.
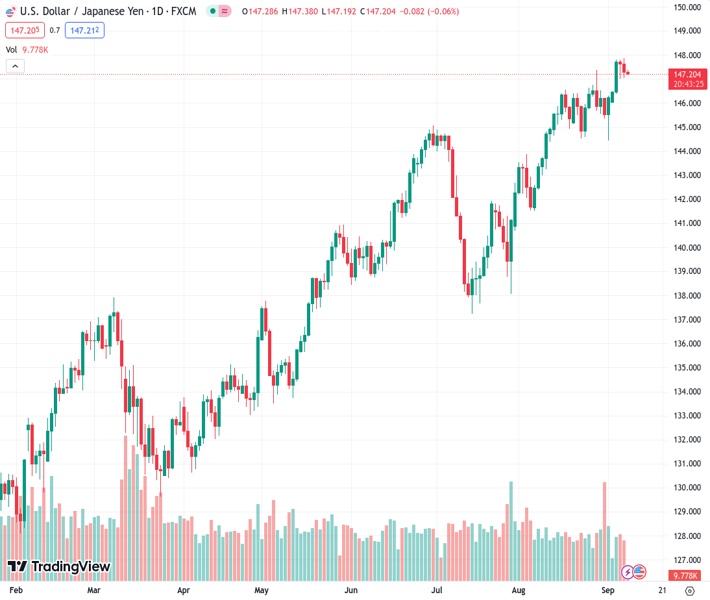
The USD/JPY pair gains traction after retracing from the multi-month high of 147.87 during the early Asian session on Friday. The pair currently trades near 147.36, up 0.04% on the day.
The latest data released by the Japanese Cabinet Office revealed that the nation’s Gross Domestic Product (GDP) for the second quarter came in at 1.2% QoQ from 1.5% in the previous reading and worse-than-expected at 1.3%. On an annual basis, the growth number grew 4.8% versus 6% prior and missed the market consensus of 5.5%. Meanwhile, Gross Domestic Product Deflator Q2 came in at 3.5% YoY from the previous reading of 3.4%. Finally, the Japanese Labor Cash Earnings for July rose 1.3% YoY versus 2.3% prior.
Bank of Japan (BoJ) policymaker Junko Nakagawa stated on Thursday that it is appropriate to maintain an easy monetary policy for the time being. He added that Japan has not yet attained the BoJ’s price target stably. It’s worth noting that the monetary policy divergence between the US and Japan might cap the upside of the Japanese Yen and act as a tailwind for USD/JPY for the time being.
Additionally, Japan’s top currency diplomat Masato Kanda stated a willingness to closely monitor FX movements with a sense of urgency and added that all options are available.
Across the pond, the US Initial Jobless Claims totaled 216,000 in the week ending September 2. This figure came in better than the market expectation of 234,000 and followed the previous week’s revised figure of 229,000 (from 228,000), the US Department of Labor reported on Thursday. Meanwhile, Nonfarm Productivity increased by 3.5%, below the 3.8% market estimation and revised from the first estimate of 3.7%. Following the data, the US dollar Index (DXY), a measure of the value of the USD relative to a basket of foreign currencies, gained momentum to the highest level since early March above the 105.00 mark.
Apart from the data, New York Federal Reserve (Fed) President John Williams stated that inflation is heading in the right direction. He added that he requires more information before making a decision. , Chicago’s Fed President Austan Goolsbee said the Fed may achieve the golden path, where inflation erases but a recession is avoided. Last week, the Federal Reserve (Fed) Governor Christopher Waller said that there is further room to increase interest rates, but the data will determine whether the Fed needs to hike rates again and if it is done hiking rates.
Looking ahead, the Japanese Eco Watchers Survey for August will be due later on Friday. Also, the US Wholesales Inventories for July and Consumer Credit Change will be released in the North American session on the same day. However, the risk sentiment and the headlines surrounding BoJ intervention will be closely watched by traders.
Technical Levels: Supports and Resistances
USDJPY currently trading at 147.34 at the time of writing. Pair opened at 147.3 and is trading with a change of 0.03 % .
| Overview | Overview.1 | |
|---|---|---|
| 0 | Today last price | 147.34 |
| 1 | Today Daily Change | 0.04 |
| 2 | Today Daily Change % | 0.03 |
| 3 | Today daily open | 147.30 |
The pair remains strongly bullish on the daily timeframe. It trades above its 20 SMA @ 146.0, 50 SMA 143.43, 100 SMA @ 140.91 and 200 SMA @ 136.96.
| Trends | Trends.1 | |
|---|---|---|
| 0 | Daily SMA20 | 146.00 |
| 1 | Daily SMA50 | 143.43 |
| 2 | Daily SMA100 | 140.91 |
| 3 | Daily SMA200 | 136.96 |
The previous day high was 147.88 while the previous day low was 147.04. The daily 38.2% Fib levels comes at 147.32, expected to provide resistance. Similarly, the daily 61.8% fib level is at 147.51, expected to provide resistance.
Note the levels of interest below:
- Pivot support is noted at 147.18, 146.7, 146.38
- Pivot resistance is noted at 147.98, 148.3, 148.78
| Levels | Levels.1 |
|---|---|
| Previous Daily High | 147.88 |
| Previous Daily Low | 147.04 |
| Previous Weekly High | 147.38 |
| Previous Weekly Low | 144.44 |
| Previous Monthly High | 147.38 |
| Previous Monthly Low | 141.51 |
| Daily Fibonacci 38.2% | 147.32 |
| Daily Fibonacci 61.8% | 147.51 |
| Daily Pivot Point S1 | 147.18 |
| Daily Pivot Point S2 | 146.70 |
| Daily Pivot Point S3 | 146.38 |
| Daily Pivot Point R1 | 147.98 |
| Daily Pivot Point R2 | 148.30 |
| Daily Pivot Point R3 | 148.78 |
[/s2If]
Download Nehcap EAWe have two EAs that are operational on our LIVE accounts.
- EA-FIX: Check out the details here. Download EA-FIX . EA-FIX is a non-grid HFT scalper.
- EA-GROWTH: High quality low dd EA using trend grids. Download EA_GROWTHJoin Our Telegram Group
")


