The USDCAD pair hovers around the range of 1.3678-1.3686, fluctuating within a tight trading range.
…
This is a premium post.
[s2If !current_user_can(access_s2member_level4)]Please register for FREE REGISTER to read full post below containing analysis. In case of any error or you think you are not able to read the full post below, please email us at support#nehcap.com [lwa][/s2If] [s2If current_user_can(access_s2member_level1)]
- USD/CAD oscillates around the 1.3678-1.3686 region in a narrow trading band.
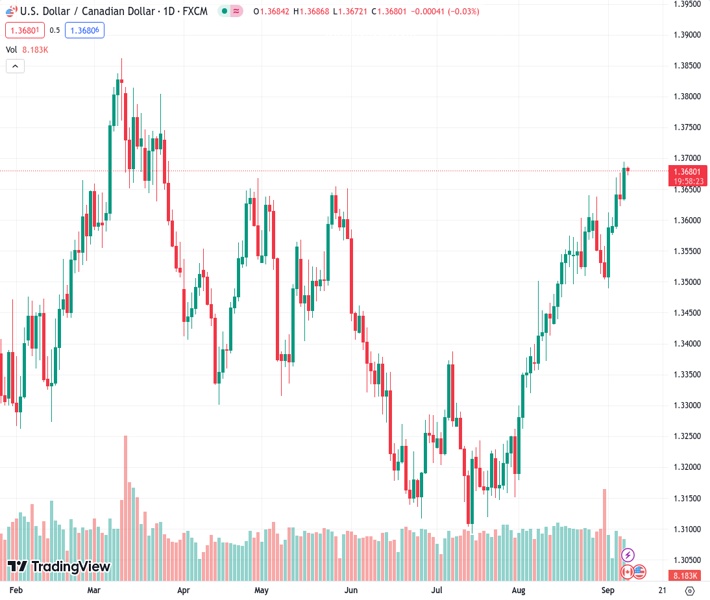
The pair currently trades last at 1.36784.
The previous day high was 1.3694 while the previous day low was 1.3632. The daily 38.2% Fib levels comes at 1.3671, expected to provide support. Similarly, the daily 61.8% fib level is at 1.3656, expected to provide support.
The USD/CAD pair consolidates its recent gains around 1.3680 during the early Asian session on Friday. The major pair retraces from 1.3694, the highest level since March and the key resistance level is seen at 1.3700 area.
The US Dollar (USD) gained traction to the highest level since early March above the 105.00 area following the US economic data on Thursday. The US Department of Labor on Thursday reported that the US Initial Jobless Claims totaled 216,000 in the week ending September 2. This figure came in better than the market consensus of 234,000 and followed the previous week’s revised figure of 229,000 (from 228,000). Meanwhile, Nonfarm Productivity rose by 3.5%, below the 3.8% market estimation and revised from the first estimate of 3.7%.
New York Federal Reserve (Fed) President John Williams stated that inflation is heading in the right direction while adding that he requires additional information before making a decision. , Chicago’s Fed President Austan Goolsbee said the Fed may achieve the golden path, where inflation erases but a recession is avoided.
That said, the US economic data lends support to the higher for longer interest rate narrative, which boosts the Greenback across the board. According to the CME FedWatch Tool, markets have priced in a 93% possibility of holding the interest rate at the September meeting, while the odds of a rate hike in its November meeting is around 51%.
On the other hand, Bank of Canada (BoC) Governor Tiff Macklem stated on Thursday that monetary policy may be appropriately restrictive to restore price stability, but cautioned that the Governing Council is concerned with the persistence of underlying inflation. It’s worth noting that BoC decided to maintain its key interest rate at 5% on Wednesday’s policy meeting.
About the data, the Canadian Ivey Purchasing Managers Index (PMI) for August came in at 53.5 from 48.6 in the previous reading. The figure was better than expected at 49.2. It’s worth noting that the number above 50 indicates expansion in the business activity. In response to the data, the Canadian Dollar (CAD) gains ground against the USD. However, a decline in oil prices limited Loonie’s upside as Canada is the largest exporter of crude to the US.
Moving on, market players await Canada’s labor data due on Friday for fresh impetus. Markets anticipate that the Canadian economy will add 15,000 jobs in August. The weaker-than-expected data might exert some pressure on the Loonie. Also, Canada’s Unemployment Rate for August will be due on the same day. These data could give a clear direction for the USD/CAD pair.
Technical Levels: Supports and Resistances
USDCAD currently trading at 1.3682 at the time of writing. Pair opened at 1.3684 and is trading with a change of -0.01 % .
| Overview | Overview.1 | |
|---|---|---|
| 0 | Today last price | 1.3682 |
| 1 | Today Daily Change | -0.0002 |
| 2 | Today Daily Change % | -0.0100 |
| 3 | Today daily open | 1.3684 |
The pair remains strongly bullish on the daily timeframe. It trades above its 20 SMA @ 1.3559, 50 SMA 1.338, 100 SMA @ 1.3404 and 200 SMA @ 1.3466.
| Trends | Trends.1 | |
|---|---|---|
| 0 | Daily SMA20 | 1.3559 |
| 1 | Daily SMA50 | 1.3380 |
| 2 | Daily SMA100 | 1.3404 |
| 3 | Daily SMA200 | 1.3466 |
The previous day high was 1.3694 while the previous day low was 1.3632. The daily 38.2% Fib levels comes at 1.3671, expected to provide support. Similarly, the daily 61.8% fib level is at 1.3656, expected to provide support.
Note the levels of interest below:
- Pivot support is noted at 1.3646, 1.3608, 1.3584
- Pivot resistance is noted at 1.3709, 1.3733, 1.3771
| Levels | Levels.1 |
|---|---|
| Previous Daily High | 1.3694 |
| Previous Daily Low | 1.3632 |
| Previous Weekly High | 1.3637 |
| Previous Weekly Low | 1.3489 |
| Previous Monthly High | 1.3640 |
| Previous Monthly Low | 1.3184 |
| Daily Fibonacci 38.2% | 1.3671 |
| Daily Fibonacci 61.8% | 1.3656 |
| Daily Pivot Point S1 | 1.3646 |
| Daily Pivot Point S2 | 1.3608 |
| Daily Pivot Point S3 | 1.3584 |
| Daily Pivot Point R1 | 1.3709 |
| Daily Pivot Point R2 | 1.3733 |
| Daily Pivot Point R3 | 1.3771 |
[/s2If]
Download Nehcap EAWe have two EAs that are operational on our LIVE accounts.
- EA-FIX: Check out the details here. Download EA-FIX . EA-FIX is a non-grid HFT scalper.
- EA-GROWTH: High quality low dd EA using trend grids. Download EA_GROWTHJoin Our Telegram Group
")


