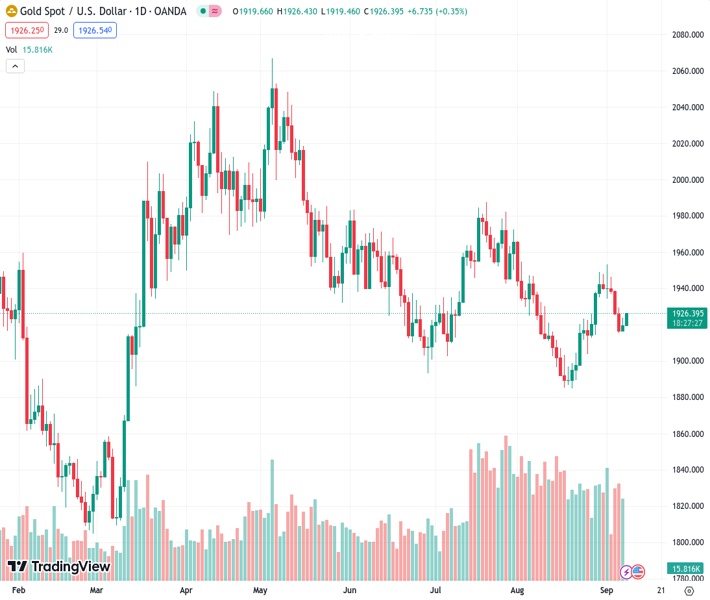
The price of gold, indicated by #XAUUSD at 1,920.48, has increased as the US Dollar (USD) weakens after a period of consistent gains.
…
This is a premium post.
[s2If !current_user_can(access_s2member_level4)]Please register for FREE REGISTER to read full post below containing analysis. In case of any error or you think you are not able to read the full post below, please email us at support#nehcap.com [lwa][/s2If] [s2If current_user_can(access_s2member_level1)]
- Gold price trades higher due to retreating in US Dollar (USD) from a winning streak.
The pair currently trades last at 1920.48.
The previous day high was 1923.63 while the previous day low was 1916.29. The daily 38.2% Fib levels comes at 1920.83, expected to provide resistance. Similarly, the daily 61.8% fib level is at 1919.09, expected to provide support.
Gold price extends its gains on the second successive day, trading higher around $1,920 a troy ounce during the Asian session on Friday. The price of the yellow metal is experiencing minor support due to the correction in the US Dollar (USD) after a three-day winning streak, which could be attributed to the correction in US Treasury yields. The yields on 10-year US Treasury bonds declined to 4.22%, down by 1.36% in two days.
US Dollar Index (DXY), which measures the performance of the Greenback against the six other major currencies, trades around 104.90 below the highest since April. The index is continuing to cheer the consistent stream of positive data regarding the state of the US economy.
United States (US) data released on Thursday showed US Initial Jobless Claims as of September 1, reported a reading of 216K, lower than the previous figure of 229K. The data was expected to rise to 234K. While US Unit Labor Costs (Q2) rose to 2.2% from 1.6% prior, which was expected to remain consistent.
US Dollar’s (USD) recent strength appears to be rooted in investors’ increasing confidence in a more hawkish approach from the US Federal Reserve (Fed). Market participants seem to price in the likelihood of a 25 basis point (bps) interest rate hike during the Fed’s November and December meetings, as well as the possibility of the Fed maintaining higher interest rates for an extended period. This scenario could potentially limit the upward trajectory of gold prices.
Investor confidence remains constrained, primarily attributed to persistent concerns over the deteriorating economic conditions in China and the ongoing trade tensions between China and the United States (US). These risks, tied to China’s economic health and trade relations, have the potential to suppress the demand for precious metal.
Nevertheless, it’s worth noting that China has implemented a series of policy measures in the recent past aimed at revitalizing its struggling economy, especially after its post-pandemic recovery experienced a swift downturn. Additionally, more policy actions are anticipated in the near future.
Furthermore, the G20 leaders’ summit is set to commence in New Delhi this Saturday. Notably, U.S. President Joe Biden will be in attendance, while Chinese President Xi Jinping will not, further exacerbating the already delicate and deteriorating relationship between the two superpowers.
When there are no significant economic releases later in the day, traders will likely observe the upcoming multiple speeches from Fed members.
Technical Levels: Supports and Resistances
XAUUSD currently trading at 1926.1 at the time of writing. Pair opened at 1919.72 and is trading with a change of 0.33 % .
| Overview | Overview.1 | |
|---|---|---|
| 0 | Today last price | 1926.10 |
| 1 | Today Daily Change | 6.38 |
| 2 | Today Daily Change % | 0.33 |
| 3 | Today daily open | 1919.72 |
The pair is trading above its 20 Daily moving average @ 1915.73, below its 50 Daily moving average @ 1932.23 , below its 100 Daily moving average @ 1951.29 and above its 200 Daily moving average @ 1918.3
| Trends | Trends.1 | |
|---|---|---|
| 0 | Daily SMA20 | 1915.73 |
| 1 | Daily SMA50 | 1932.23 |
| 2 | Daily SMA100 | 1951.29 |
| 3 | Daily SMA200 | 1918.30 |
The previous day high was 1923.63 while the previous day low was 1916.29. The daily 38.2% Fib levels comes at 1920.83, expected to provide resistance. Similarly, the daily 61.8% fib level is at 1919.09, expected to provide support.
Note the levels of interest below:
- Pivot support is noted at 1916.13, 1912.54, 1908.79
- Pivot resistance is noted at 1923.47, 1927.22, 1930.81
| Levels | Levels.1 |
|---|---|
| Previous Daily High | 1923.63 |
| Previous Daily Low | 1916.29 |
| Previous Weekly High | 1953.01 |
| Previous Weekly Low | 1912.84 |
| Previous Monthly High | 1966.08 |
| Previous Monthly Low | 1884.85 |
| Daily Fibonacci 38.2% | 1920.83 |
| Daily Fibonacci 61.8% | 1919.09 |
| Daily Pivot Point S1 | 1916.13 |
| Daily Pivot Point S2 | 1912.54 |
| Daily Pivot Point S3 | 1908.79 |
| Daily Pivot Point R1 | 1923.47 |
| Daily Pivot Point R2 | 1927.22 |
| Daily Pivot Point R3 | 1930.81 |
[/s2If]
Download Nehcap EAWe have two EAs that are operational on our LIVE accounts.
- EA-FIX: Check out the details here. Download EA-FIX . EA-FIX is a non-grid HFT scalper.
- EA-GROWTH: High quality low dd EA using trend grids. Download EA_GROWTHJoin Our Telegram Group
")


