The pair USDCAD encountered resistance on Friday and faced some downward pressure due to a slight decline in the value of the USD.
…
This is a premium post.
[s2If !current_user_can(access_s2member_level4)]Please register for FREE REGISTER to read full post below containing analysis. In case of any error or you think you are not able to read the full post below, please email us at support#nehcap.com [lwa][/s2If] [s2If current_user_can(access_s2member_level1)]
- USD/CAD meets with some supply on Friday and is pressured by a modest USD weakness.
The pair currently trades last at 1.36784.
The previous day high was 1.3694 while the previous day low was 1.3632. The daily 38.2% Fib levels comes at 1.3671, expected to provide support. Similarly, the daily 61.8% fib level is at 1.3656, expected to provide support.
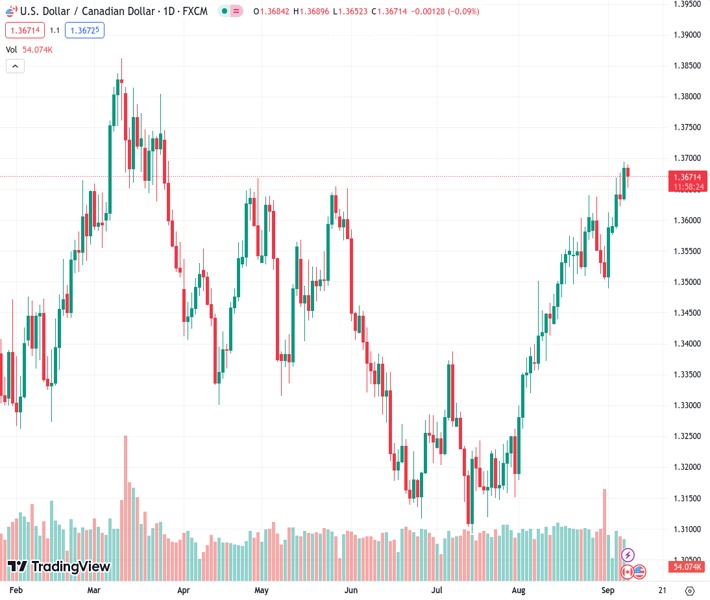
The USD/CAD pair comes under some selling pressure on Friday and reverses a part of the previous day’s positive move to the 1.3700 neighbourhood, or its highest level since late March. Spot prices, however, manage to rebound a few pips from the daily low and trade around the 1.3665-1.3670 area during the first half of the European session, down less than 0.15% for the day.
A modest US Dollar (USD) retracement slide from a six-month top, triggered by retreating US Treasury bond yields, turns out to be a key factor exerting some downward pressure on the USD/CAD pair. That said, expectations that the Federal Reserve (Fed) will keep interest rates higher for longer should act as a tailwind for the US bond yields and the USD. Apart from this, a softer tone surrounding Crude Oil prices undermines the commodity-linked Loonie and contributes to limiting the downside for the major. Traders also seem reluctant to place aggressive bets and prefer to wait for the release of the Canadian jobs report, due later during the early North American session.
From a technical perspective, the intraday downtick stalls near the 1.3650 horizontal resistance breakpoint, now turned support. Any further decline is more likely to attract fresh buyers and remain limited near the 1.3600 round-figure mark. The latter should act as a key pivotal point, which if broken decisively should pave the way for some meaningful corrective decline. The USD/CAD pair might then accelerate the slide towards the next relevant support near the 1.3525 region en route to the 1.3500 1.3500 psychological mark. Some follow-through selling will expose the very important 200-day Simple Moving Average (SMA), currently currently around the 1.3460 region.
On the flip side, bullish traders might now wait for a sustained strength beyond the 1.3700 mark before placing fresh bets. The subsequent move-up has the potential to lift the USD/CAD pair towards the 1.3730 resistance zone en route to the 1.3800 round figure. The upward trajectory could get extended further and push spot prices towards retesting the YTD top, around the 1.3860 region touched in March.
Technical Levels: Supports and Resistances
USDCAD currently trading at 1.3668 at the time of writing. Pair opened at 1.3684 and is trading with a change of -0.12 % .
| Overview | Overview.1 | |
|---|---|---|
| 0 | Today last price | 1.3668 |
| 1 | Today Daily Change | -0.0016 |
| 2 | Today Daily Change % | -0.1200 |
| 3 | Today daily open | 1.3684 |
The pair remains strongly bullish on the daily timeframe. It trades above its 20 SMA @ 1.3559, 50 SMA 1.338, 100 SMA @ 1.3404 and 200 SMA @ 1.3466.
| Trends | Trends.1 | |
|---|---|---|
| 0 | Daily SMA20 | 1.3559 |
| 1 | Daily SMA50 | 1.3380 |
| 2 | Daily SMA100 | 1.3404 |
| 3 | Daily SMA200 | 1.3466 |
The previous day high was 1.3694 while the previous day low was 1.3632. The daily 38.2% Fib levels comes at 1.3671, expected to provide support. Similarly, the daily 61.8% fib level is at 1.3656, expected to provide support.
Note the levels of interest below:
- Pivot support is noted at 1.3646, 1.3608, 1.3584
- Pivot resistance is noted at 1.3709, 1.3733, 1.3771
| Levels | Levels.1 |
|---|---|
| Previous Daily High | 1.3694 |
| Previous Daily Low | 1.3632 |
| Previous Weekly High | 1.3637 |
| Previous Weekly Low | 1.3489 |
| Previous Monthly High | 1.3640 |
| Previous Monthly Low | 1.3184 |
| Daily Fibonacci 38.2% | 1.3671 |
| Daily Fibonacci 61.8% | 1.3656 |
| Daily Pivot Point S1 | 1.3646 |
| Daily Pivot Point S2 | 1.3608 |
| Daily Pivot Point S3 | 1.3584 |
| Daily Pivot Point R1 | 1.3709 |
| Daily Pivot Point R2 | 1.3733 |
| Daily Pivot Point R3 | 1.3771 |
[/s2If]
Download Nehcap EAWe have two EAs that are operational on our LIVE accounts.
- EA-FIX: Check out the details here. Download EA-FIX . EA-FIX is a non-grid HFT scalper.
- EA-GROWTH: High quality low dd EA using trend grids. Download EA_GROWTHJoin Our Telegram Group
")


