The EURJPY currency pair is currently at 157.549 and is maintaining a position above the 157.60 level. However, it is still below both the 50-hour and 100-hour Exponential Moving Averages (EMAs).
…
This is a premium post.
[s2If !current_user_can(access_s2member_level4)]Please register for FREE REGISTER to read full post below containing analysis. In case of any error or you think you are not able to read the full post below, please email us at support#nehcap.com [lwa][/s2If] [s2If current_user_can(access_s2member_level1)]
- EUR/JPY holds above the 157.60 mark but remains below the 50- and 100-hour EMAs.
The pair currently trades last at 157.549.
The previous day high was 158.52 while the previous day low was 157.36. The daily 38.2% Fib levels comes at 157.81, expected to provide resistance. Similarly, the daily 61.8% fib level is at 158.08, expected to provide resistance.
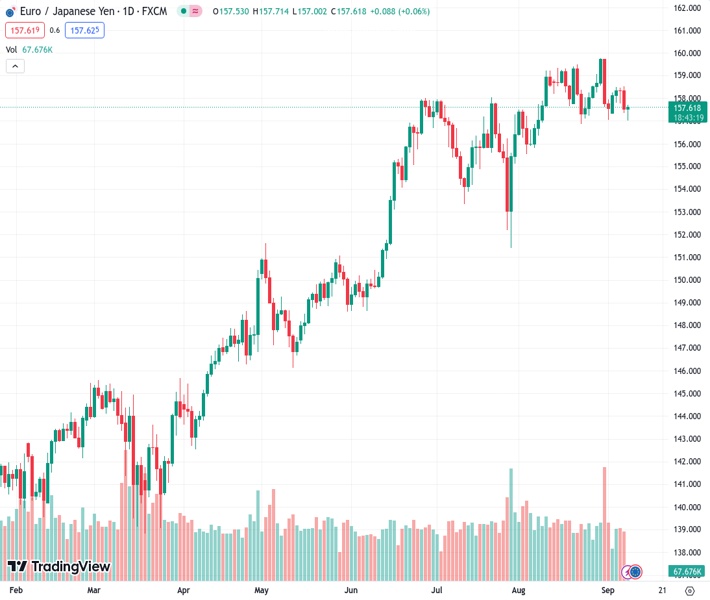
The EUR/JPY cross has a volatile session during the early Asian session on Friday. The cross bounces off the weekly low of 157.00 area and currently trades around 157.65, gaining 0.06% on the day. The Japanese Yen (JPY) weakened against the Euro (EUR) following the release of Japan’s Gross Domestic Product (GDP) for the second quarter.
The Japanese Cabinet Office reported on Friday that the country’s Gross Domestic Product (GDP) for Q2 came in at 1.2% QoQ from the previous reading of 1.5% and below expectations of 1.3%. The annual growth number was 4.8% compared to 6% in the previous reading and missed the market consensus of 5.5%. Additionally, the Gross Domestic Product Deflator Q2 came in at 3.5% YoY from the previous reading of 3.4%. Finally, the Japanese Labor Cash Earnings for July increased by 1.3% YoY compared to 2.2% in June.
On Thursday, Bank of Japan (BoJ) policymaker Junko Nakagawa stated that it is appropriate to maintain an easy monetary policy for the time being. It’s worth noting that the monetary policy divergence between the US and Japan might cap the upside of the Japanese Yen and act as a tailwind for EUR/JPY for the time being.
According to the one-hour chart, EUR/JPY holds below the 50- and 100-hour Exponential Moving Averages (EMAs) with a downward slope, which means further downside looks favorable. Meanwhile, the Relative Strength Index (RSI) stands below 50, within bearish territory, suggesting that sellers will likely retain control soon.
Therefore, the cross could meet the immediate resistance level near the 50-hour EMA at 157.88. The key barrier to watch is located at 158.00, representing a confluence of the 100-hour EMA, the upper boundary of the Bollinger Band, and a psychological round mark. A break above the latter will see a rally to 158.50 (a high of September 6).
On the downside, the critical support level to watch is near the lower limit of the Bollinger Band and a low of August 25 at 157.20. Any extended weakness below the latter will see a drop to a psychological round figure at 157.00. Further south, the cross will see the next downside stop at 156.35 (a low of August 8) and finally at 155.80 (a low of August 7).
Technical Levels: Supports and Resistances
EURJPY currently trading at 157.66 at the time of writing. Pair opened at 157.56 and is trading with a change of 0.06 % .
| Overview | Overview.1 | |
|---|---|---|
| 0 | Today last price | 157.66 |
| 1 | Today Daily Change | 0.10 |
| 2 | Today Daily Change % | 0.06 |
| 3 | Today daily open | 157.56 |
The pair is trading below its 20 Daily moving average @ 158.38, above its 50 Daily moving average @ 157.13 , above its 100 Daily moving average @ 153.91 and above its 200 Daily moving average @ 148.31
| Trends | Trends.1 | |
|---|---|---|
| 0 | Daily SMA20 | 158.38 |
| 1 | Daily SMA50 | 157.13 |
| 2 | Daily SMA100 | 153.91 |
| 3 | Daily SMA200 | 148.31 |
The previous day high was 158.52 while the previous day low was 157.36. The daily 38.2% Fib levels comes at 157.81, expected to provide resistance. Similarly, the daily 61.8% fib level is at 158.08, expected to provide resistance.
Note the levels of interest below:
- Pivot support is noted at 157.11, 156.65, 155.94
- Pivot resistance is noted at 158.27, 158.98, 159.43
| Levels | Levels.1 |
|---|---|
| Previous Daily High | 158.52 |
| Previous Daily Low | 157.36 |
| Previous Weekly High | 159.76 |
| Previous Weekly Low | 157.06 |
| Previous Monthly High | 159.76 |
| Previous Monthly Low | 155.53 |
| Daily Fibonacci 38.2% | 157.81 |
| Daily Fibonacci 61.8% | 158.08 |
| Daily Pivot Point S1 | 157.11 |
| Daily Pivot Point S2 | 156.65 |
| Daily Pivot Point S3 | 155.94 |
| Daily Pivot Point R1 | 158.27 |
| Daily Pivot Point R2 | 158.98 |
| Daily Pivot Point R3 | 159.43 |
[/s2If]
Download Nehcap EAWe have two EAs that are operational on our LIVE accounts.
- EA-FIX: Check out the details here. Download EA-FIX . EA-FIX is a non-grid HFT scalper.
- EA-GROWTH: High quality low dd EA using trend grids. Download EA_GROWTHJoin Our Telegram Group
")


