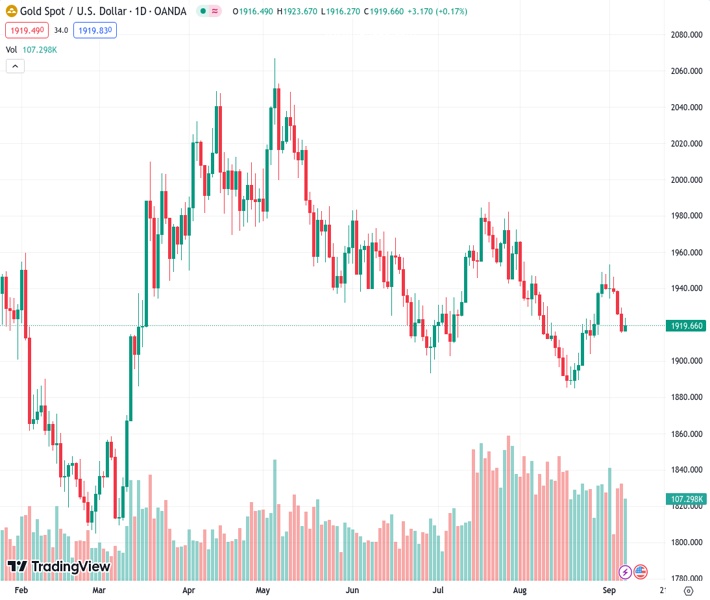
The XAUUSD pair, currently at a value of 1,920.48, received significant backing when it reached the intersection of the 20 and 200-day Simple Moving Averages (SMA) at $1,915.
…
This is a premium post.
[s2If !current_user_can(access_s2member_level4)]Please register for FREE REGISTER to read full post below containing analysis. In case of any error or you think you are not able to read the full post below, please email us at support#nehcap.com [lwa][/s2If] [s2If current_user_can(access_s2member_level1)]
- XAU/USD found support at the convergence of the 20 and 200-day SMAs at $1,915.
The pair currently trades last at 1920.48.
The previous day high was 1929.21 while the previous day low was 1915.33. The daily 38.2% Fib levels comes at 1920.63, expected to provide resistance. Similarly, the daily 61.8% fib level is at 1923.91, expected to provide resistance.
The Gold Spot price XAU/USD recovered some ground after finding support at the $1,915 area, jumping towards $1,920. However, the upside is limited as the expectations of one last Federal Reserve (Fed) hike grow in the markets.
During the American session, it was reported that Initial Jobless Claims for the first week of September came in lower than expected. The figure came in at 216,000, lower than the expected figure of 234,000 and declining from the previous 228,000.
The US Treasury yields, often seen as the opportunity cost of holding non-yielding metals, declined on Thursday and allowed the yellow metal to gather momentum. That being said, they still remain high as markets are placing bets on the Federal Reserve (Fed) hiking again in this tightening cycle, in November or in December, as the US is showing evidence of its economic activity remaining strong despite the Fed’s aggressive moves. The focus shifts to next week’s Consumer Price Index (CPI) data from the US in order for markets to continue modelling their expectations.
Based on the daily chart, XAU/USD maintains a neutral to bearish technical perspective, suggesting that the bears are gradually gaining momentum but are not yet in total control. The Relative Strength Index (RSI) exhibits a positive slope below its midline, while the Moving Average Convergence (MACD) lays out decreasing green bars.
Support levels: $1,915 (Convergence of 20 and 200-day SMA), $1,900, $1,880.
Resistance levels: $1,930, $1,950, $1,970.
Technical Levels: Supports and Resistances
XAUUSD currently trading at 1919.72 at the time of writing. Pair opened at 1916.76 and is trading with a change of 0.15 % .
| Overview | Overview.1 | |
|---|---|---|
| 0 | Today last price | 1919.72 |
| 1 | Today Daily Change | 2.96 |
| 2 | Today Daily Change % | 0.15 |
| 3 | Today daily open | 1916.76 |
The pair is trading above its 20 Daily moving average @ 1915.35, below its 50 Daily moving average @ 1932.0 , below its 100 Daily moving average @ 1952.15 and above its 200 Daily moving average @ 1917.55
| Trends | Trends.1 | |
|---|---|---|
| 0 | Daily SMA20 | 1915.35 |
| 1 | Daily SMA50 | 1932.00 |
| 2 | Daily SMA100 | 1952.15 |
| 3 | Daily SMA200 | 1917.55 |
The previous day high was 1929.21 while the previous day low was 1915.33. The daily 38.2% Fib levels comes at 1920.63, expected to provide resistance. Similarly, the daily 61.8% fib level is at 1923.91, expected to provide resistance.
Note the levels of interest below:
- Pivot support is noted at 1911.66, 1906.55, 1897.78
- Pivot resistance is noted at 1925.54, 1934.31, 1939.42
| Levels | Levels.1 |
|---|---|
| Previous Daily High | 1929.21 |
| Previous Daily Low | 1915.33 |
| Previous Weekly High | 1953.01 |
| Previous Weekly Low | 1912.84 |
| Previous Monthly High | 1966.08 |
| Previous Monthly Low | 1884.85 |
| Daily Fibonacci 38.2% | 1920.63 |
| Daily Fibonacci 61.8% | 1923.91 |
| Daily Pivot Point S1 | 1911.66 |
| Daily Pivot Point S2 | 1906.55 |
| Daily Pivot Point S3 | 1897.78 |
| Daily Pivot Point R1 | 1925.54 |
| Daily Pivot Point R2 | 1934.31 |
| Daily Pivot Point R3 | 1939.42 |
[/s2If]
Download Nehcap EAWe have two EAs that are operational on our LIVE accounts.
- EA-FIX: Check out the details here. Download EA-FIX . EA-FIX is a non-grid HFT scalper.
- EA-GROWTH: High quality low dd EA using trend grids. Download EA_GROWTHJoin Our Telegram Group
")


