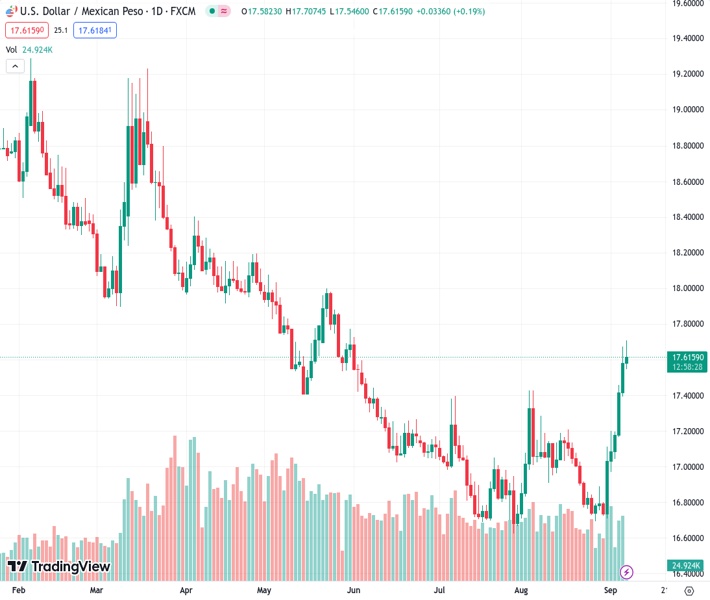
The USDMXN currency pair continues to rise for the sixth consecutive day, reaching a three-month peak on Thursday.
…
This is a premium post.
[s2If !current_user_can(access_s2member_level4)]Please register for FREE REGISTER to read full post below containing analysis. In case of any error or you think you are not able to read the full post below, please email us at support#nehcap.com [lwa][/s2If] [s2If current_user_can(access_s2member_level1)]
- USD/MXN scales higher for the sixth straight day and touches a three-month high on Thursday.
The pair currently trades last at 17.6163.
The previous day high was 17.6772 while the previous day low was 17.3957. The daily 38.2% Fib levels comes at 17.5697, expected to provide support. Similarly, the daily 61.8% fib level is at 17.5032, expected to provide support.
The USD/MXN pair gains strong positive traction for the sixth successive day on Thursday and jumps to over a three-month top during the early part of the European session. Spot prices, however, retreat a few pips in the last hour and currently trade near the 17.65 region, still up nearly 0.40% for the day.
From a technical perspective, this week’s sustained move and acceptance above the 100-day Simple Moving Average (SMA), for the first time since September 2022, was seen as a fresh trigger for bullish traders. A subsequent breakout through the 17.40-17.45 strong horizontal barrier prompted some follow-through technical buying and might have already set the stage for a further near-term appreciating move.
That said, the Relative Strength Index (RSI) on the daily chart is already flashing overbought conditions and makes it prudent to wait for some near-term consolidation or a modest pullback before placing fresh bets. Nevertheless, the USD/MXN pair seems poised to build on its sharp rise witnessed over the past week or so and aim to challenge the very important 200-day SMA, currently around the 18.00 mark.
The said handle coincides with a downward sloping trend-line extending from the September 2022 swing high and should act as a key pivotal point, which if cleared decisively should pave the way for additional gains.
On the flip side, any meaningful corrective slide below the daily trough, around the 17.60-17.55 region, could be seen as a buying opportunity and remain limited near the 17.45-17.40 resistance breakpoint. This is closely followed by the 100-day SMA, around the 17.30-17.25 zone. Failure to defend the said support levels might prompt some technical selling and drag the USD/MXN pair back towards the 17.00 round figure.
Technical Levels: Supports and Resistances
USDMXN currently trading at 17.6367 at the time of writing. Pair opened at 17.5758 and is trading with a change of 0.35 % .
| Overview | Overview.1 | |
|---|---|---|
| 0 | Today last price | 17.6367 |
| 1 | Today Daily Change | 0.0609 |
| 2 | Today Daily Change % | 0.3500 |
| 3 | Today daily open | 17.5758 |
The pair is trading above its 20 Daily moving average @ 17.0289, above its 50 Daily moving average @ 16.9892 , above its 100 Daily moving average @ 17.2853 and below its 200 Daily moving average @ 18.0364
| Trends | Trends.1 | |
|---|---|---|
| 0 | Daily SMA20 | 17.0289 |
| 1 | Daily SMA50 | 16.9892 |
| 2 | Daily SMA100 | 17.2853 |
| 3 | Daily SMA200 | 18.0364 |
The previous day high was 17.6772 while the previous day low was 17.3957. The daily 38.2% Fib levels comes at 17.5697, expected to provide support. Similarly, the daily 61.8% fib level is at 17.5032, expected to provide support.
Note the levels of interest below:
- Pivot support is noted at 17.4219, 17.2681, 17.1404
- Pivot resistance is noted at 17.7034, 17.8311, 17.9849
| Levels | Levels.1 |
|---|---|
| Previous Daily High | 17.6772 |
| Previous Daily Low | 17.3957 |
| Previous Weekly High | 17.2025 |
| Previous Weekly Low | 16.6945 |
| Previous Monthly High | 17.4274 |
| Previous Monthly Low | 16.6945 |
| Daily Fibonacci 38.2% | 17.5697 |
| Daily Fibonacci 61.8% | 17.5032 |
| Daily Pivot Point S1 | 17.4219 |
| Daily Pivot Point S2 | 17.2681 |
| Daily Pivot Point S3 | 17.1404 |
| Daily Pivot Point R1 | 17.7034 |
| Daily Pivot Point R2 | 17.8311 |
| Daily Pivot Point R3 | 17.9849 |
[/s2If]
Download Nehcap EAWe have two EAs that are operational on our LIVE accounts.
- EA-FIX: Check out the details here. Download EA-FIX . EA-FIX is a non-grid HFT scalper.
- EA-GROWTH: High quality low dd EA using trend grids. Download EA_GROWTHJoin Our Telegram Group
")


