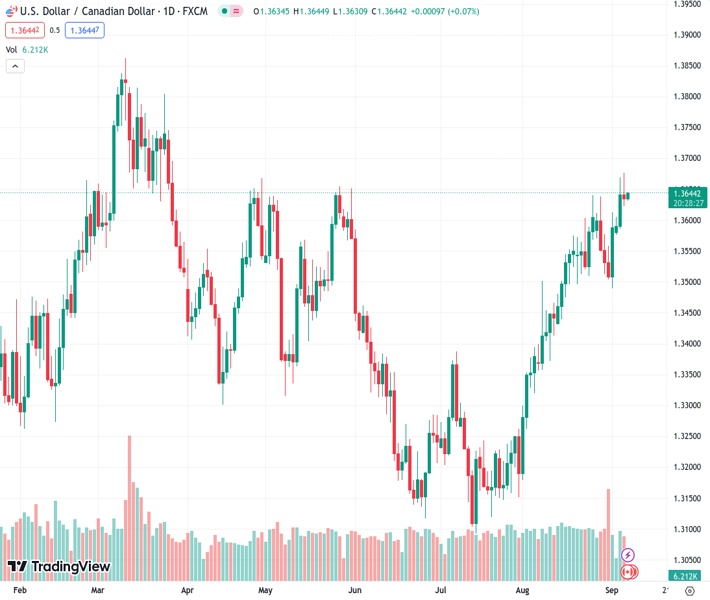
The US dollar remains in high demand, causing the USDCAD to gain momentum near the 1.3642 level.
…
This is a premium post.
[s2If !current_user_can(access_s2member_level4)]Please register for FREE REGISTER to read full post below containing analysis. In case of any error or you think you are not able to read the full post below, please email us at support#nehcap.com [lwa][/s2If] [s2If current_user_can(access_s2member_level1)]
- USD/CAD gains ground near 1.3642 amid the US Dollar demand.
The pair currently trades last at 1.36426.
The previous day high was 1.3677 while the previous day low was 1.3623. The daily 38.2% Fib levels comes at 1.3643, expected to provide resistance. Similarly, the daily 61.8% fib level is at 1.3656, expected to provide resistance.
The USD/CAD pair gains momentum below the mid-1.3600s during the early Asian trading hours on Thursday. Meanwhile, the US Dollar Index (DXY) hovers around 104.85, retreating from 105.00 following the release of the US ISM Services PMI. The major pair currently trades near 1.3642, up 0.04% on the day.
On Wednesday, the Bank of Canada (BoC) maintained its key overnight interest rate unchanged at 5%, as anticipated by the market. The BoC Governing Council stated that the central bank leaves the door open for another rate rise as core inflation measures remain elevated. BoC policymakers added that the economy has entered a period of slower expansion, which is required to alleviate inflationary pressures.
About last week’s data, Canadian real Gross Domestic Product (GDP) Annualized for the second quarter contracted at 0.2% YoY against the previous reading of 2.6%. The growth number was worse than expected with a 1.2% expansion. Meanwhile, the rally in oil prices might lift the Loonie as Canada is the largest exporter of crude to the US.
On the other hand, the US Dollar edges higher amid the cautious mood in the market as investors await China’s Trade Data. Meanwhile, markets expect the Federal Reserve (Fed) will keep interest rates over 5% for a longer period. The Federal Reserve (Fed) Governor Christopher Waller stated that they have further room to increase interest rates, but the data will determine whether the Fed needs to hike rates again and if it is done hiking rates.
Data released from the Institute for Supply Management (ISM) showed on Wednesday that the US ISM Services PMI rose to 54.5 in August from 52.7 the previous month, above the market consensus of 52.5. This figure is the highest since February. Furthermore, the S&P Global Composite’s final readings fell to 50.2 in August from 50.4 in July.
Looking ahead, the weekly US Initial Jobless Claims, quarterly Nonfarm Productivity data, and Unit Labour Costs for the second quarter (Q2) will be released. On the Canadian docket, Canada’s labor market data for August will be closely watched. The Unemployment Rate is expected to rise 5.6%. These data could give a clear direction for the USD/CAD pair.
Technical Levels: Supports and Resistances
USDCAD currently trading at 1.3644 at the time of writing. Pair opened at 1.3636 and is trading with a change of 0.06 % .
| Overview | Overview.1 | |
|---|---|---|
| 0 | Today last price | 1.3644 |
| 1 | Today Daily Change | 0.0008 |
| 2 | Today Daily Change % | 0.0600 |
| 3 | Today daily open | 1.3636 |
The pair remains strongly bullish on the daily timeframe. It trades above its 20 SMA @ 1.3547, 50 SMA 1.3371, 100 SMA @ 1.3402 and 200 SMA @ 1.3465.
| Trends | Trends.1 | |
|---|---|---|
| 0 | Daily SMA20 | 1.3547 |
| 1 | Daily SMA50 | 1.3371 |
| 2 | Daily SMA100 | 1.3402 |
| 3 | Daily SMA200 | 1.3465 |
The previous day high was 1.3677 while the previous day low was 1.3623. The daily 38.2% Fib levels comes at 1.3643, expected to provide resistance. Similarly, the daily 61.8% fib level is at 1.3656, expected to provide resistance.
Note the levels of interest below:
- Pivot support is noted at 1.3613, 1.3591, 1.3559
- Pivot resistance is noted at 1.3668, 1.37, 1.3722
| Levels | Levels.1 |
|---|---|
| Previous Daily High | 1.3677 |
| Previous Daily Low | 1.3623 |
| Previous Weekly High | 1.3637 |
| Previous Weekly Low | 1.3489 |
| Previous Monthly High | 1.3640 |
| Previous Monthly Low | 1.3184 |
| Daily Fibonacci 38.2% | 1.3643 |
| Daily Fibonacci 61.8% | 1.3656 |
| Daily Pivot Point S1 | 1.3613 |
| Daily Pivot Point S2 | 1.3591 |
| Daily Pivot Point S3 | 1.3559 |
| Daily Pivot Point R1 | 1.3668 |
| Daily Pivot Point R2 | 1.3700 |
| Daily Pivot Point R3 | 1.3722 |
[/s2If]
Download Nehcap EAWe have two EAs that are operational on our LIVE accounts.
- EA-FIX: Check out the details here. Download EA-FIX . EA-FIX is a non-grid HFT scalper.
- EA-GROWTH: High quality low dd EA using trend grids. Download EA_GROWTHJoin Our Telegram Group
")


