The price of silver, with the XAGUSD symbol, is staying low at its lowest point in two weeks, according to the analysis provided by Nehcap. It is predicted that there will only be a small decrease in the value of silver.
…
This is a premium post.
[s2If !current_user_can(access_s2member_level4)]Please register for FREE REGISTER to read full post below containing analysis. In case of any error or you think you are not able to read the full post below, please email us at support#nehcap.com [lwa][/s2If] [s2If current_user_can(access_s2member_level1)]
- Silver Price remains depressed at the lowest level in two weeks.
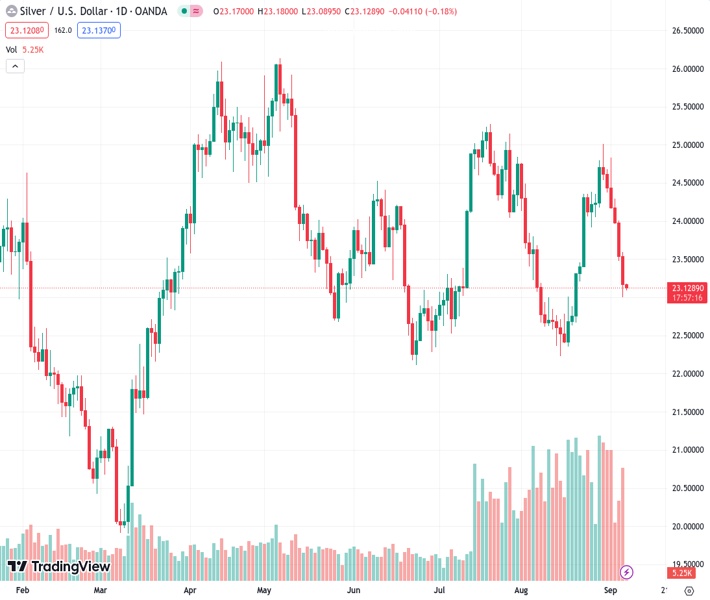
The pair currently trades last at 23.127.
The previous day high was 23.6 while the previous day low was 23.0. The daily 38.2% Fib levels comes at 23.23, expected to provide resistance. Similarly, the daily 61.8% fib level is at 23.37, expected to provide resistance.
Silver Price (XAG/USD) dropped for the seventh consecutive day while fading the previous day’s corrective bounce off a two-week low by declining to $23.10 early Thursday morning. In doing so, the bright metal justifies the bearish MACD signals and a clear downside break of the 200-day Exponential Moving Average (EMA).
In addition to the technical signals, the market’s downbeat sentiment and the broadly firmer US Dollar also keep the XAG/USD sellers hopeful.
However, the RSI (14) line is below 50.0 and suggests bottom-picking of the commodity, which in turn highlights an ascending support line from early March, close to $22.60 as the key level to watch for the bears.
It’s worth noting that the precious metal’s failure to rebound from $22.60, will make it vulnerable to test a one-year-long rising trend line, close to $22.10, quickly followed by the $22.00 threshold.
In a case where the Silver Price remains bearish past $22.00, the odds of witnessing a gradual downside toward March’s low of around $19.90 can’t be ruled out. During the likely fall, the 50.0% and 61.8% Fibonacci ratios of September 2022 to May 2023 upside, respectively near $21.85 and $20.80, as well as the $20.00 psychological magnet, can test the XAG/USD sellers.
Alternatively, a daily closing beyond the 200-EMA level of $23.25 isn’t an open invitation to the Silver buyers as multiple levels around $24.00 and $24.20 may test the Silver Price recovery before highlighting the key resistance line stretched from May, close to $24.70 at the latest.
Trend: Limited downside expected
Technical Levels: Supports and Resistances
XAGUSD currently trading at 23.12 at the time of writing. Pair opened at 23.18 and is trading with a change of -0.26% % .
| Overview | Overview.1 | |
|---|---|---|
| 0 | Today last price | 23.12 |
| 1 | Today Daily Change | -0.06 |
| 2 | Today Daily Change % | -0.26% |
| 3 | Today daily open | 23.18 |
The pair remains strongly bearish on the daily time frame. It trades below the 20 SMA @ 23.53, 50 SMA 23.73, 100 SMA @ 23.89 and 200 SMA @ 23.47.
| Trends | Trends.1 | |
|---|---|---|
| 0 | Daily SMA20 | 23.53 |
| 1 | Daily SMA50 | 23.73 |
| 2 | Daily SMA100 | 23.89 |
| 3 | Daily SMA200 | 23.47 |
The previous day high was 23.6 while the previous day low was 23.0. The daily 38.2% Fib levels comes at 23.23, expected to provide resistance. Similarly, the daily 61.8% fib level is at 23.37, expected to provide resistance.
Note the levels of interest below:
- Pivot support is noted at 22.92, 22.67, 22.33
- Pivot resistance is noted at 23.52, 23.85, 24.11
| Levels | Levels.1 |
|---|---|
| Previous Daily High | 23.60 |
| Previous Daily Low | 23.00 |
| Previous Weekly High | 25.02 |
| Previous Weekly Low | 24.05 |
| Previous Monthly High | 25.02 |
| Previous Monthly Low | 22.23 |
| Daily Fibonacci 38.2% | 23.23 |
| Daily Fibonacci 61.8% | 23.37 |
| Daily Pivot Point S1 | 22.92 |
| Daily Pivot Point S2 | 22.67 |
| Daily Pivot Point S3 | 22.33 |
| Daily Pivot Point R1 | 23.52 |
| Daily Pivot Point R2 | 23.85 |
| Daily Pivot Point R3 | 24.11 |
[/s2If]
Download Nehcap EAWe have two EAs that are operational on our LIVE accounts.
- EA-FIX: Check out the details here. Download EA-FIX . EA-FIX is a non-grid HFT scalper.
- EA-GROWTH: High quality low dd EA using trend grids. Download EA_GROWTHJoin Our Telegram Group
")


