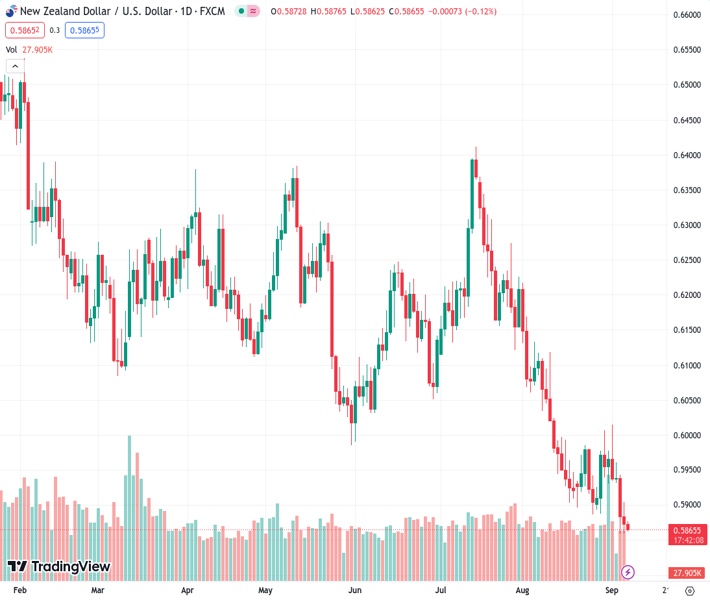
The NZDUSD pair is hovering close to its lowest point so far this year at 0.58637 and is facing downward pressure due to the strengthening US dollar.
…
This is a premium post.
[s2If !current_user_can(access_s2member_level4)]Please register for FREE REGISTER to read full post below containing analysis. In case of any error or you think you are not able to read the full post below, please email us at support#nehcap.com [lwa][/s2If] [s2If current_user_can(access_s2member_level1)]
- NZD/USD languishes near the YTD trough and is pressured by a bullish USD.
The pair currently trades last at 0.58637.
The previous day high was 0.5899 while the previous day low was 0.5859. The daily 38.2% Fib levels comes at 0.5875, expected to provide resistance. Similarly, the daily 61.8% fib level is at 0.5884, expected to provide resistance.
The NZD/USD pair remains on the defensive through the Asian session on Thursday and currently trades around the 0.5865-0.5860 region, or its lowest level since November 2022.
The US Dollar (USD) stands tall near a six-month peak in the wake of growing acceptance that the Federal Reserve (Fed) will keep rates higher for longer and turns out to be a key factor weighing on the NZD/USD pair. The markets now seem convinced that the US central bank will stick to its hawkish stance and the bets were reaffirmed by Wednesday’s upbeat US macro data, indicating that business activity in the US services sector unexpectedly picked up pace in August.
In fact, the US ISM Non-Manufacturing PMI rose from 52.7 in July to 54.5 last month – the highest level since February. Additional details of the report showed a rise in new orders, pointing to a resilient US economy, and higher Prices Paid sub-component, which was seen as potential signs of still-elevated inflation pressures. This, in turn, increases the odds for one more 25 bps Fed rate hike move by the end of this year and continues to act as a tailwind for the Greenback.
The outlook, meanwhile, remains supportive of elevated US Treasury bond yields, which, along with a softer tone around the equity markets benefits the safe-haven buck and does little to provide any respite to the risk-sensitive Kiwi. Market participants now seem worried about economic headwinds stemming from rising borrowing costs. This comes on the back of a slowdown in China – the world’s second-largest economy – and tempers investors’ appetite for riskier assets.
The aforementioned fundamental backdrop suggests that the path of least resistance for the NZD/USD pair is to the downside. That said, the Relative Strength Index (RSI) on the daily chart has moved on the verge of breaking into the oversold territory and holds back bearish traders from placing fresh bets. This makes it prudent to wait for some near-term consolidation before positioning for an extension of the well-established downtrend witnessed over the past two months or so.
Traders now look to the release of the Weekly Initial Jobless Claims data from the US, which, along with speeches by influential FOMC members and the US bond yields, will influence the USD price dynamics and provide some impetus to the NZD/USD pair. Apart from this, the broader risk sentiment might further contribute to producing short-term trading opportunities around the major.
Technical Levels: Supports and Resistances
NZDUSD currently trading at 0.5866 at the time of writing. Pair opened at 0.5873 and is trading with a change of -0.12 % .
| Overview | Overview.1 | |
|---|---|---|
| 0 | Today last price | 0.5866 |
| 1 | Today Daily Change | -0.0007 |
| 2 | Today Daily Change % | -0.1200 |
| 3 | Today daily open | 0.5873 |
The pair remains strongly bearish on the daily time frame. It trades below the 20 SMA @ 0.5942, 50 SMA 0.6089, 100 SMA @ 0.6129 and 200 SMA @ 0.6216.
| Trends | Trends.1 | |
|---|---|---|
| 0 | Daily SMA20 | 0.5942 |
| 1 | Daily SMA50 | 0.6089 |
| 2 | Daily SMA100 | 0.6129 |
| 3 | Daily SMA200 | 0.6216 |
The previous day high was 0.5899 while the previous day low was 0.5859. The daily 38.2% Fib levels comes at 0.5875, expected to provide resistance. Similarly, the daily 61.8% fib level is at 0.5884, expected to provide resistance.
Note the levels of interest below:
- Pivot support is noted at 0.5855, 0.5838, 0.5816
- Pivot resistance is noted at 0.5895, 0.5917, 0.5934
| Levels | Levels.1 |
|---|---|
| Previous Daily High | 0.5899 |
| Previous Daily Low | 0.5859 |
| Previous Weekly High | 0.6015 |
| Previous Weekly Low | 0.5887 |
| Previous Monthly High | 0.6219 |
| Previous Monthly Low | 0.5885 |
| Daily Fibonacci 38.2% | 0.5875 |
| Daily Fibonacci 61.8% | 0.5884 |
| Daily Pivot Point S1 | 0.5855 |
| Daily Pivot Point S2 | 0.5838 |
| Daily Pivot Point S3 | 0.5816 |
| Daily Pivot Point R1 | 0.5895 |
| Daily Pivot Point R2 | 0.5917 |
| Daily Pivot Point R3 | 0.5934 |
[/s2If]
Download Nehcap EAWe have two EAs that are operational on our LIVE accounts.
- EA-FIX: Check out the details here. Download EA-FIX . EA-FIX is a non-grid HFT scalper.
- EA-GROWTH: High quality low dd EA using trend grids. Download EA_GROWTHJoin Our Telegram Group
")


