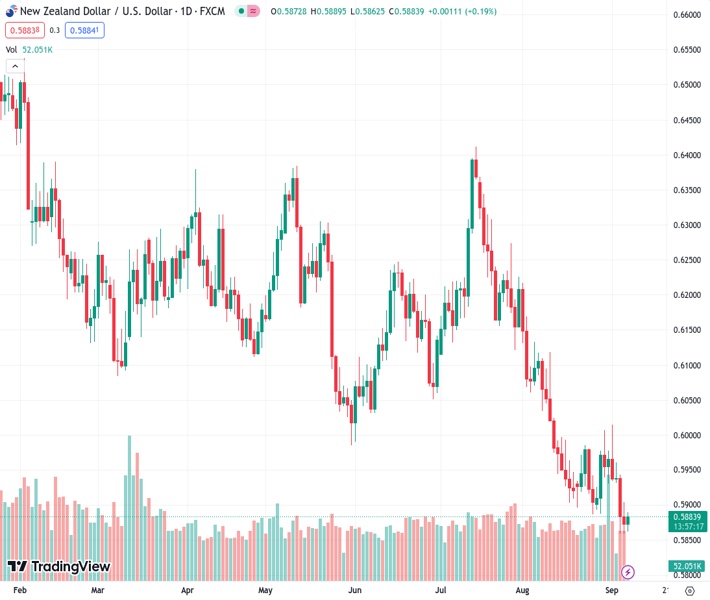
The NZDUSD currency pair is facing difficulty in regaining ground after reaching its lowest level since November 2022.
…
This is a premium post.
[s2If !current_user_can(access_s2member_level4)]Please register for FREE REGISTER to read full post below containing analysis. In case of any error or you think you are not able to read the full post below, please email us at support#nehcap.com [lwa][/s2If] [s2If current_user_can(access_s2member_level1)]
- NZD/USD struggles to recover from its lowest since November 2022.
The pair currently trades last at 0.58828.
The previous day high was 0.5899 while the previous day low was 0.5859. The daily 38.2% Fib levels comes at 0.5875, expected to provide support. Similarly, the daily 61.8% fib level is at 0.5884, expected to provide resistance.
NZD/USD trades around 0.5890 during the Asian session on Thursday, recovering from the lowest level since November 2022. However, the pair is facing downward pressure as investors price in the odds for a quarter basis points (bps) interest rate hike by the US Federal Reserve (Fed) through the end of the year 2023.
Additionally, the US Dollar (USD) is strengthening due to increasing acknowledgment that the Federal Reserve (Fed) intends to maintain higher interest rates for an extended period. This hawkish tone surrounding the central bank has emerged as a significant factor influencing the pair negatively.
Market sentiment is currently leaning towards the belief that the US Fed will adhere to its hawkish policy stance. This conviction has been further reinforced by positive US economic data released on Wednesday, which revealed an unexpected acceleration in business activity within the US services sector during August.
US ISM Services PMI exceeded expectations in August by reaching a six-month high reading of 54.5, surpassing the anticipated figure of 52.5 and the previous reading of 52.7. However, the S&P Global Composite and Services PMIs declined to 50.2 and 50.5, respectively, falling short of market estimates of 50.4 and 51.0.
It’s noteworthy that the moderate performance of US economic indicators seems to provide downward pressure for the Kiwi pair.
US Dollar Index (DXY), which gauges the value of the US Dollar (USD) against six other major currencies, is hovering around 104.80. The prevailing hawkish sentiment regarding the Fed policy decision in the upcoming September meeting continues to bolster US Treasury yields.
The higher yields reinforce the confidence of buyers in the Greenback. At the time of writing, the 10-year US bond yield has climbed to 4.29%, marking a 0.23% increase.
Investor confidence remains subdued as concerns persist about the deteriorating economic conditions in China and the ongoing trade tensions between the United States and China. These China-linked risks are exerting downward pressure on the New Zealand Dollar (NZD) owing to the strong trade ties between the two nations.
Technical Levels: Supports and Resistances
NZDUSD currently trading at 0.5872 at the time of writing. Pair opened at 0.5873 and is trading with a change of -0.02 % .
| Overview | Overview.1 | |
|---|---|---|
| 0 | Today last price | 0.5872 |
| 1 | Today Daily Change | -0.0001 |
| 2 | Today Daily Change % | -0.0200 |
| 3 | Today daily open | 0.5873 |
The pair remains strongly bearish on the daily time frame. It trades below the 20 SMA @ 0.5942, 50 SMA 0.6089, 100 SMA @ 0.6129 and 200 SMA @ 0.6216.
| Trends | Trends.1 | |
|---|---|---|
| 0 | Daily SMA20 | 0.5942 |
| 1 | Daily SMA50 | 0.6089 |
| 2 | Daily SMA100 | 0.6129 |
| 3 | Daily SMA200 | 0.6216 |
The previous day high was 0.5899 while the previous day low was 0.5859. The daily 38.2% Fib levels comes at 0.5875, expected to provide support. Similarly, the daily 61.8% fib level is at 0.5884, expected to provide resistance.
Note the levels of interest below:
- Pivot support is noted at 0.5855, 0.5838, 0.5816
- Pivot resistance is noted at 0.5895, 0.5917, 0.5934
| Levels | Levels.1 |
|---|---|
| Previous Daily High | 0.5899 |
| Previous Daily Low | 0.5859 |
| Previous Weekly High | 0.6015 |
| Previous Weekly Low | 0.5887 |
| Previous Monthly High | 0.6219 |
| Previous Monthly Low | 0.5885 |
| Daily Fibonacci 38.2% | 0.5875 |
| Daily Fibonacci 61.8% | 0.5884 |
| Daily Pivot Point S1 | 0.5855 |
| Daily Pivot Point S2 | 0.5838 |
| Daily Pivot Point S3 | 0.5816 |
| Daily Pivot Point R1 | 0.5895 |
| Daily Pivot Point R2 | 0.5917 |
| Daily Pivot Point R3 | 0.5934 |
[/s2If]
Download Nehcap EAWe have two EAs that are operational on our LIVE accounts.
- EA-FIX: Check out the details here. Download EA-FIX . EA-FIX is a non-grid HFT scalper.
- EA-GROWTH: High quality low dd EA using trend grids. Download EA_GROWTHJoin Our Telegram Group
")


