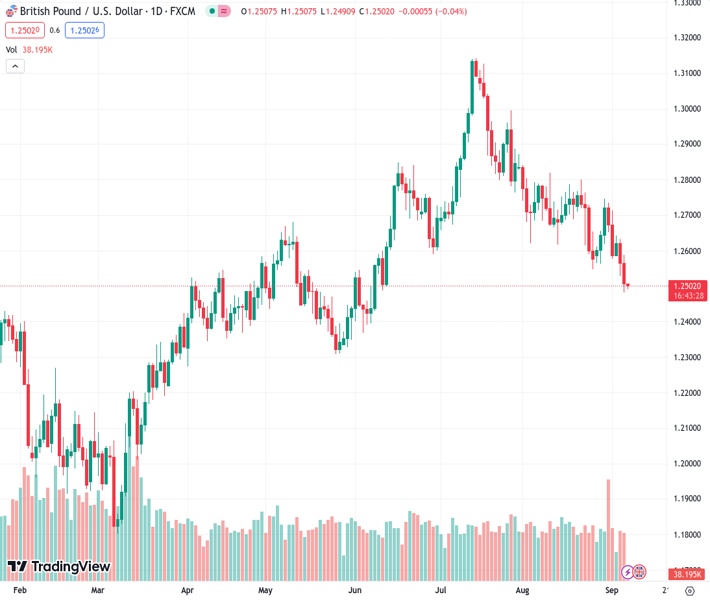
The GBPUSD pair is unchanged around the 1.2500 level, which is close to the three-month low reached on Wednesday.
…
This is a premium post.
[s2If !current_user_can(access_s2member_level4)]Please register for FREE REGISTER to read full post below containing analysis. In case of any error or you think you are not able to read the full post below, please email us at support#nehcap.com [lwa][/s2If] [s2If current_user_can(access_s2member_level1)]
- GBP/USD remains flat around 1.2500, near a three-month low hit on Wednesday.
The pair currently trades last at 1.25039.
The previous day high was 1.2588 while the previous day low was 1.2482. The daily 38.2% Fib levels comes at 1.2523, expected to provide resistance. Similarly, the daily 61.8% fib level is at 1.2548, expected to provide resistance.
The GBP/USD pair consolidates its recent losses around 1.2500 during the Asian session on Thursday. Meanwhile, the US Dollar Index (DXY), a measure of the value of USD against six other major currencies, hovers around 104.80 after retreating from the highest level since March. The strength of the Greenback is bolstered by the upbeat US ISM Services PMI, which came in better than expected and improved to a six-month high level of 54.5 in August.
On the other hand, the Pound Sterling (GBP) was weakened by Bank of England (BoE) Governor Andrew Bailey’s dovish remark on Wednesday. He stated that BoE is much closer to ending its hiking cycle.
From the technical perspective, GBP/USD holds below the 50- and 100-hour Exponential Moving Averages (EMAs) with a downward slope on the one-hour chart, which means further downside looks favorable. Meanwhile, the Relative Strength Index (RSI) stands below 50, within bearish territory, suggesting that sellers are likely to retain control in the near term.
Any extended weakness below the lower limit of the Bollinger Band at 1.2465 will challenge the next contention at 1.2440 (a low of May 12) en route to 1.2390 (a low of June 6) and finally at 1.2350 (a low of May 31).
On the upside, the middle line of the Bollinger Band at 1.2515 acts as an immediate resistance level for GBP/USD. The additional upside filter is located at 1.2545 (50-hour EMA). Further north, the 1.2565-2575 zone appears a tough nut to crack for the Pound Sterling bears. The mentioned level represents the upper boundary of the Bollinger Band and the 100-hour EMA. The next barrier is seen near a psychological round mark at 1.2600.
Technical Levels: Supports and Resistances
GBPUSD currently trading at 1.2505 at the time of writing. Pair opened at 1.2508 and is trading with a change of -0.02 % .
| Overview | Overview.1 | |
|---|---|---|
| 0 | Today last price | 1.2505 |
| 1 | Today Daily Change | -0.0003 |
| 2 | Today Daily Change % | -0.0200 |
| 3 | Today daily open | 1.2508 |
The pair is trading below its 20 Daily moving average @ 1.2665, below its 50 Daily moving average @ 1.2769 , below its 100 Daily moving average @ 1.2654 and above its 200 Daily moving average @ 1.2424
| Trends | Trends.1 | |
|---|---|---|
| 0 | Daily SMA20 | 1.2665 |
| 1 | Daily SMA50 | 1.2769 |
| 2 | Daily SMA100 | 1.2654 |
| 3 | Daily SMA200 | 1.2424 |
The previous day high was 1.2588 while the previous day low was 1.2482. The daily 38.2% Fib levels comes at 1.2523, expected to provide resistance. Similarly, the daily 61.8% fib level is at 1.2548, expected to provide resistance.
Note the levels of interest below:
- Pivot support is noted at 1.2464, 1.242, 1.2358
- Pivot resistance is noted at 1.257, 1.2632, 1.2676
| Levels | Levels.1 |
|---|---|
| Previous Daily High | 1.2588 |
| Previous Daily Low | 1.2482 |
| Previous Weekly High | 1.2746 |
| Previous Weekly Low | 1.2563 |
| Previous Monthly High | 1.2841 |
| Previous Monthly Low | 1.2548 |
| Daily Fibonacci 38.2% | 1.2523 |
| Daily Fibonacci 61.8% | 1.2548 |
| Daily Pivot Point S1 | 1.2464 |
| Daily Pivot Point S2 | 1.2420 |
| Daily Pivot Point S3 | 1.2358 |
| Daily Pivot Point R1 | 1.2570 |
| Daily Pivot Point R2 | 1.2632 |
| Daily Pivot Point R3 | 1.2676 |
[/s2If]
Download Nehcap EAWe have two EAs that are operational on our LIVE accounts.
- EA-FIX: Check out the details here. Download EA-FIX . EA-FIX is a non-grid HFT scalper.
- EA-GROWTH: High quality low dd EA using trend grids. Download EA_GROWTHJoin Our Telegram Group
")


