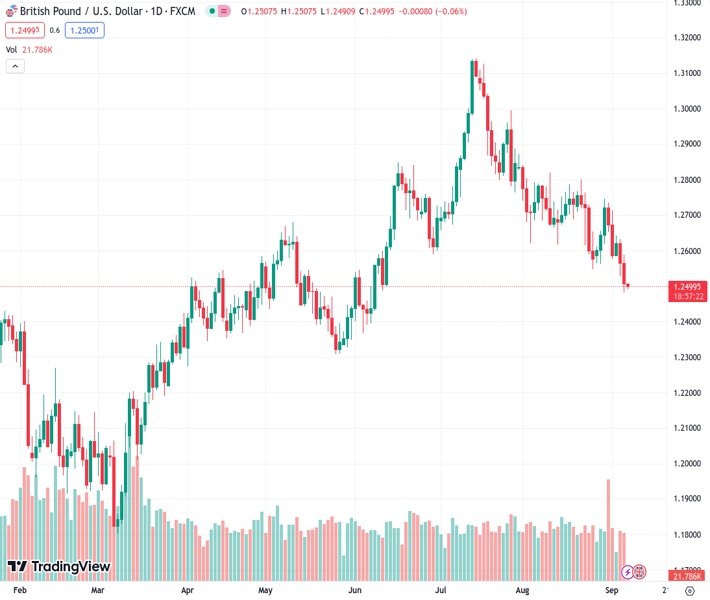
The GBPUSD pair is maintaining a defensive stance close to its three-month low reached on Wednesday at the price level of 1.24993.
…
This is a premium post.
[s2If !current_user_can(access_s2member_level4)]Please register for FREE REGISTER to read full post below containing analysis. In case of any error or you think you are not able to read the full post below, please email us at support#nehcap.com [lwa][/s2If] [s2If current_user_can(access_s2member_level1)]
- GBP/USD remains on the defensive near a three-month low touched on Wednesday.
The pair currently trades last at 1.24993.
The previous day high was 1.2588 while the previous day low was 1.2482. The daily 38.2% Fib levels comes at 1.2523, expected to provide resistance. Similarly, the daily 61.8% fib level is at 1.2548, expected to provide resistance.
The GBP/USD pair enters a bearish consolidation phase during the Asian session on Thursday and oscillates in a range just above a three-month low touched the previous day. Spot prices currently trade around the 1.2500 psychological mark and seem vulnerable to prolonging a nearly two-month-old descending trend.
The US Dollar (USD) takes a brief pause following the recent rally to its highest level since March 9 and turns out to be a key factor lending some support to the GBP/USD pair. Any meaningful USD corrective slide, meanwhile, still seems elusive in the wake of firming expectations that the Federal Reserve (Fed) will keep interest rates higher for longer. The bets were reaffirmed by the overnight release of the upbeat US ISM Services PMI, which surpassed even the most optimistic estimates and rose to a six-month high level of 54.5 in August.
Additional details of the report showed a rise in new orders and pointed to a resilient US economy. Furthermore, the higher Prices Paid sub-component was seen as a potential signs of still-elevated inflation pressures. This should allow the Fed to stick to its hawkish stance and increase the odds of an interest rate hike in November. The outlook, meanwhile, remains supportive of elevated US Treasury bond yields, which, along with a generally weaker risk tone, supports prospects for a further appreciating move for the safe-haven buck.
The British Pound (GBP), on the other hand, is undermined by the Bank of England (BoE) Governor Andrew Bailey’s dovish signal on Wednesday, saying that the central bank is much nearer to ending its run of interest rate increases. Testifying to Parliament, Bailey and two MPC members said that the BoE is worried that further tightening could cause an unnecessarily harsh recession. This, along with the aforementioned USD supportive fundamental backdrop, suggests that the path of least resistance for the GBP/USD pair is to the downside.
Moving ahead, there isn’t any relevant market-moving economic data due for release from the UK on Thursday, leaving spot prices at the mercy of the USD price dynamics. Later during the early North American session, traders will take cues from the Weekly Initial Jobless Claims data from the US and speeches by influential FOMC members. This, along with the US bond yields and the broader risk sentiment, will influence the USD price dynamics and produce short-term trading opportunities around the GBP/USD pair.
Technical Levels: Supports and Resistances
GBPUSD currently trading at 1.2493 at the time of writing. Pair opened at 1.2508 and is trading with a change of -0.12 % .
| Overview | Overview.1 | |
|---|---|---|
| 0 | Today last price | 1.2493 |
| 1 | Today Daily Change | -0.0015 |
| 2 | Today Daily Change % | -0.1200 |
| 3 | Today daily open | 1.2508 |
The pair is trading below its 20 Daily moving average @ 1.2665, below its 50 Daily moving average @ 1.2769 , below its 100 Daily moving average @ 1.2654 and above its 200 Daily moving average @ 1.2424
| Trends | Trends.1 | |
|---|---|---|
| 0 | Daily SMA20 | 1.2665 |
| 1 | Daily SMA50 | 1.2769 |
| 2 | Daily SMA100 | 1.2654 |
| 3 | Daily SMA200 | 1.2424 |
The previous day high was 1.2588 while the previous day low was 1.2482. The daily 38.2% Fib levels comes at 1.2523, expected to provide resistance. Similarly, the daily 61.8% fib level is at 1.2548, expected to provide resistance.
Note the levels of interest below:
- Pivot support is noted at 1.2464, 1.242, 1.2358
- Pivot resistance is noted at 1.257, 1.2632, 1.2676
| Levels | Levels.1 |
|---|---|
| Previous Daily High | 1.2588 |
| Previous Daily Low | 1.2482 |
| Previous Weekly High | 1.2746 |
| Previous Weekly Low | 1.2563 |
| Previous Monthly High | 1.2841 |
| Previous Monthly Low | 1.2548 |
| Daily Fibonacci 38.2% | 1.2523 |
| Daily Fibonacci 61.8% | 1.2548 |
| Daily Pivot Point S1 | 1.2464 |
| Daily Pivot Point S2 | 1.2420 |
| Daily Pivot Point S3 | 1.2358 |
| Daily Pivot Point R1 | 1.2570 |
| Daily Pivot Point R2 | 1.2632 |
| Daily Pivot Point R3 | 1.2676 |
[/s2If]
Download Nehcap EAWe have two EAs that are operational on our LIVE accounts.
- EA-FIX: Check out the details here. Download EA-FIX . EA-FIX is a non-grid HFT scalper.
- EA-GROWTH: High quality low dd EA using trend grids. Download EA_GROWTHJoin Our Telegram Group
")


