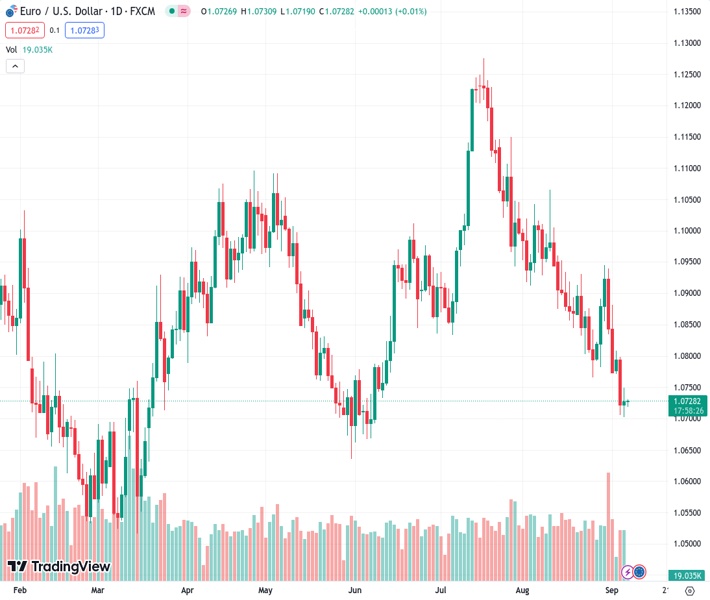
The EURUSD pair experienced a decline to 1.07275 as a result of the US Federal Reserve adopting a more assertive stance.
…
This is a premium post.
[s2If !current_user_can(access_s2member_level4)]Please register for FREE REGISTER to read full post below containing analysis. In case of any error or you think you are not able to read the full post below, please email us at support#nehcap.com [lwa][/s2If] [s2If current_user_can(access_s2member_level1)]
- EUR/USD weakened due to the hawkish tone surrounding the US Fed.
The pair currently trades last at 1.07275.
The previous day high was 1.0749 while the previous day low was 1.0703. The daily 38.2% Fib levels comes at 1.0731, expected to provide resistance. Similarly, the daily 61.8% fib level is at 1.072, expected to provide support.
EUR/USD treads waters to extend its gains for the second consecutive day, trading slightly higher around 1.0730 during the Asian session on Thursday. The firmer US Dollar (USD) is weighing on the EUR/USD pair as the investors seem to cheer up the hawkish tone surrounding the Federal Reserve (Fed) to maintain interest rates at a higher level for an extended period.
The Moving Average Convergence Divergence (MACD) line stays below the centerline and shows divergence below the signal line. This suggests that the recent momentum is relatively bearish.
The pair could meet the immediate support around the weekly low at 1.0702 lined up with the 1.0700 psychological level. A firm break below the latter could open the doors for the EUR/USD pair to navigate the area around June’s low at 1.0661 level.
On the upside, the nine-day Exponential Moving Average (EMA) emerges as the key resistance, followed by the 1.0800 psychological level.
In case the Euro bulls become active, the pair could break above that level, leading to exploring the area around the 14-day EMA at 1.0810 aligned to 23.6% Fibonacci retracement at 1.0838 level.
The 14-day Relative Strength Index (RSI) stays below 50, which suggests the EUR/USD pair remains to be bearish in the short term.
Technical Levels: Supports and Resistances
EURUSD currently trading at 1.0726 at the time of writing. Pair opened at 1.0727 and is trading with a change of -0.01 % .
| Overview | Overview.1 | |
|---|---|---|
| 0 | Today last price | 1.0726 |
| 1 | Today Daily Change | -0.0001 |
| 2 | Today Daily Change % | -0.0100 |
| 3 | Today daily open | 1.0727 |
The pair remains strongly bearish on the daily time frame. It trades below the 20 SMA @ 1.0853, 50 SMA 1.0957, 100 SMA @ 1.0916 and 200 SMA @ 1.0822.
| Trends | Trends.1 | |
|---|---|---|
| 0 | Daily SMA20 | 1.0853 |
| 1 | Daily SMA50 | 1.0957 |
| 2 | Daily SMA100 | 1.0916 |
| 3 | Daily SMA200 | 1.0822 |
The previous day high was 1.0749 while the previous day low was 1.0703. The daily 38.2% Fib levels comes at 1.0731, expected to provide resistance. Similarly, the daily 61.8% fib level is at 1.072, expected to provide support.
Note the levels of interest below:
- Pivot support is noted at 1.0704, 1.068, 1.0657
- Pivot resistance is noted at 1.075, 1.0772, 1.0796
| Levels | Levels.1 |
|---|---|
| Previous Daily High | 1.0749 |
| Previous Daily Low | 1.0703 |
| Previous Weekly High | 1.0946 |
| Previous Weekly Low | 1.0772 |
| Previous Monthly High | 1.1065 |
| Previous Monthly Low | 1.0766 |
| Daily Fibonacci 38.2% | 1.0731 |
| Daily Fibonacci 61.8% | 1.0720 |
| Daily Pivot Point S1 | 1.0704 |
| Daily Pivot Point S2 | 1.0680 |
| Daily Pivot Point S3 | 1.0657 |
| Daily Pivot Point R1 | 1.0750 |
| Daily Pivot Point R2 | 1.0772 |
| Daily Pivot Point R3 | 1.0796 |
[/s2If]
Download Nehcap EAWe have two EAs that are operational on our LIVE accounts.
- EA-FIX: Check out the details here. Download EA-FIX . EA-FIX is a non-grid HFT scalper.
- EA-GROWTH: High quality low dd EA using trend grids. Download EA_GROWTHJoin Our Telegram Group
")


