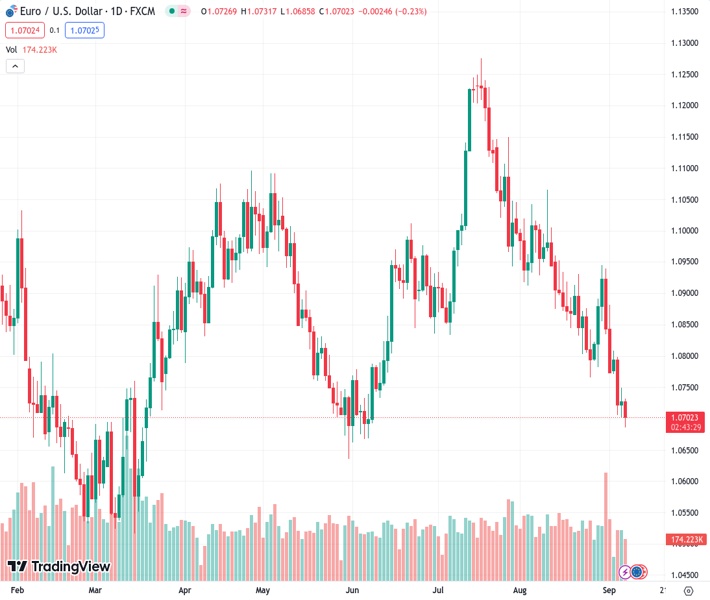
The EURUSD currency pair is currently trading at 1.0707, with a decrease of 0.19%. This comes after the US jobless claims report of 216K, which surpassed the expected figure of 229K. This has led to speculation about the possibility of a rate hike by the Federal Reserve.
…
This is a premium post.
[s2If !current_user_can(access_s2member_level4)]Please register for FREE REGISTER to read full post below containing analysis. In case of any error or you think you are not able to read the full post below, please email us at support#nehcap.com [lwa][/s2If] [s2If current_user_can(access_s2member_level1)]
- EUR/USD trades at 1.0707, down 0.19%, as US jobless claims of 216K outperform the expected 229K, fueling a Fed rate hike speculation.
The pair currently trades last at 1.07067.
The previous day high was 1.0749 while the previous day low was 1.0703. The daily 38.2% Fib levels comes at 1.0731, expected to provide resistance. Similarly, the daily 61.8% fib level is at 1.072, expected to provide resistance.
The Euro (EUR) caps its fall against the Greenback (USD) but remains trading with losses of 0.19% after data from the Eurozone shows the bloc grew at a marginal pace. Contrarily, the United States (US) labor market remains robust, as demonstrated by data. The EUR/USD is trading at 1.0700 after hitting a daily high of 1.0731.
Data revealed from the US Burea of Labor Statistics (BLS) showed the jobs market remains resilient amidst 525 basis points of tightening by the Fed, as Initial Jobless Claims for the last week printed 216K new fillings for unemployment, well below the 229K foreseen by analysts. This data spurred a repricing of further tightening by the US Federal Reserve, with chances for a 25 bps hike in November ticking up to 43%. Regarding September’s meeting, money market futures have priced in the Fed would stay put.
Consequently, the EUR/USD pair edged lower and hit a low of 1.0688. Since then, the pair has recovered territory and the 1.0700 figure, sponsored by US Treasury bond yields, registering modest losses. At the same time, the Greenback lost some ground, as the US Dollar Index (DXY) fell below the 105.000 mark but clung to gains of 0.11%.
Earlier in the European session, Eurostat revealed the Gross Domestic Product (GDP) for the second quarter (Q2) in the bloc grew by just 0.1%, lower than the 0.3% expected by the markets. Although the EU had missed a recession, recently revealed data showing that business activity is slowing, Industrial Production is dropping, and hawkish stances by European Central Bank (ECB) policysetters could pave the way for an economic contraction in the Eurozone.
Given the backdrop, the EUR/USD pair is set to continue to weaken despite the ECB’s hawkish commentary. Although inflation remains high, downside risks in the EU compared to the United States (US) paint a gloomy scenario for Europe. At the upcoming September meeting, traders expect the ECB to keep rates unchanged, though Lagarde and Co are foreseen to deliver a hawkish statement.
The pair’s fall below 1.0700 has opened the door for further losses, with sellers eyeing the next intermediate support at 1.0635, the May 31 swing low. Once cleared, there’s no demand area until the EUR/USD drops towards the March 15 daily low at 1.0516. Conversely, buyers can remain hopeful of higher prices if the major prints a daily close above 1.0700. First resistance would be September 7 high at 1.0731, followed by the September 6 high at 1.0748 and 1.0800.
Technical Levels: Supports and Resistances
EURUSD currently trading at 1.0699 at the time of writing. Pair opened at 1.0727 and is trading with a change of -0.26 % .
| Overview | Overview.1 | |
|---|---|---|
| 0 | Today last price | 1.0699 |
| 1 | Today Daily Change | -0.0028 |
| 2 | Today Daily Change % | -0.2600 |
| 3 | Today daily open | 1.0727 |
The pair remains strongly bearish on the daily time frame. It trades below the 20 SMA @ 1.0853, 50 SMA 1.0957, 100 SMA @ 1.0916 and 200 SMA @ 1.0822.
| Trends | Trends.1 | |
|---|---|---|
| 0 | Daily SMA20 | 1.0853 |
| 1 | Daily SMA50 | 1.0957 |
| 2 | Daily SMA100 | 1.0916 |
| 3 | Daily SMA200 | 1.0822 |
The previous day high was 1.0749 while the previous day low was 1.0703. The daily 38.2% Fib levels comes at 1.0731, expected to provide resistance. Similarly, the daily 61.8% fib level is at 1.072, expected to provide resistance.
Note the levels of interest below:
- Pivot support is noted at 1.0704, 1.068, 1.0657
- Pivot resistance is noted at 1.075, 1.0772, 1.0796
| Levels | Levels.1 |
|---|---|
| Previous Daily High | 1.0749 |
| Previous Daily Low | 1.0703 |
| Previous Weekly High | 1.0946 |
| Previous Weekly Low | 1.0772 |
| Previous Monthly High | 1.1065 |
| Previous Monthly Low | 1.0766 |
| Daily Fibonacci 38.2% | 1.0731 |
| Daily Fibonacci 61.8% | 1.0720 |
| Daily Pivot Point S1 | 1.0704 |
| Daily Pivot Point S2 | 1.0680 |
| Daily Pivot Point S3 | 1.0657 |
| Daily Pivot Point R1 | 1.0750 |
| Daily Pivot Point R2 | 1.0772 |
| Daily Pivot Point R3 | 1.0796 |
[/s2If]
Download Nehcap EAWe have two EAs that are operational on our LIVE accounts.
- EA-FIX: Check out the details here. Download EA-FIX . EA-FIX is a non-grid HFT scalper.
- EA-GROWTH: High quality low dd EA using trend grids. Download EA_GROWTHJoin Our Telegram Group
")


