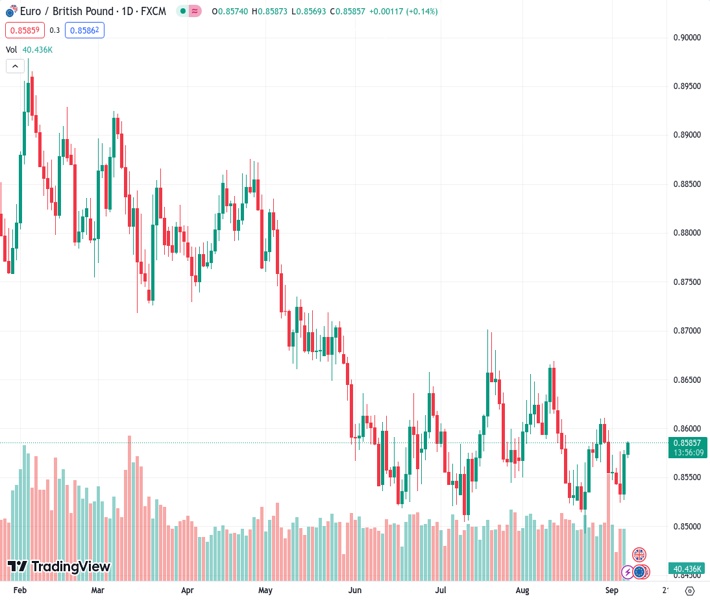
The EURGBP currency pair is currently trading at 0.85839 and can be observed moving within a downward trend channel on the four-hour chart.
…
This is a premium post.
[s2If !current_user_can(access_s2member_level4)]Please register for FREE REGISTER to read full post below containing analysis. In case of any error or you think you are not able to read the full post below, please email us at support#nehcap.com [lwa][/s2If] [s2If current_user_can(access_s2member_level1)]
- EUR/GBP trades within a descending trend channel on the four-hour chart.
The pair currently trades last at 0.85839.
The previous day high was 0.8578 while the previous day low was 0.8528. The daily 38.2% Fib levels comes at 0.8559, expected to provide support. Similarly, the daily 61.8% fib level is at 0.8547, expected to provide support.
The EUR/GBP cross gains momentum above the mid-0.8500s during the early European session on Thursday. The cross currently trades near 0.8576, unchanged for the day.
The latest data revealed on Thursday that German Industrial Production (IP) for July fell -2.1% YoY from a 1.5% drop (revised from a 1.5% drop) in the previous month. On a monthly basis, the figure dropped 0.8% versus a 1.4% decline in June and below the expectation of a 0.5% drop. However, the Pound Sterling (GBP) is weakened against the Euro as the Bank of England (BoE) Governor Andrew Bailey’s dovish remark on Wednesday that the central bank is much closer to ending its hiking cycle.
From a technical perspective, EUR/GBP trades within a descending trend channel since the middle of June on the four-hour chart. That said, That said, the path of least resistance for the cross is to the upside as EUR/GBP holds above the 50- and 100-hour Exponential Moving Averages (EMAs).
The critical resistance level for the cross is seen at 0.8600, representing a psychological round mark and a high of August 28. The next barrier to watch is 0.8626 (the upper boundary of a descending trend channel) en route to a high of August 11 at 0.8670 and finally near a high of July 19 at 0.8700.
On the flip side, the initial support level is seen at 0.8563 (50-hour EMA). The next downside stop is located at 0.8540 (a low of September 4). The additional downside filter is located at 0.8524 (a low of September 5). The key contention will emerge at 0.8500, portraying a lower limit of a descending trend channel and a psychological figure.
It’s worth noting that the Relative Strength Index (RSI) and Moving Average Convergence/Divergence (MACD) stand in bullish territory, supporting the buyers for now.
Technical Levels: Supports and Resistances
EURGBP currently trading at 0.8576 at the time of writing. Pair opened at 0.8577 and is trading with a change of -0.01 % .
| Overview | Overview.1 | |
|---|---|---|
| 0 | Today last price | 0.8576 |
| 1 | Today Daily Change | -0.0001 |
| 2 | Today Daily Change % | -0.0100 |
| 3 | Today daily open | 0.8577 |
The pair is trading above its 20 Daily moving average @ 0.857, below its 50 Daily moving average @ 0.8582 , below its 100 Daily moving average @ 0.8627 and below its 200 Daily moving average @ 0.8712
| Trends | Trends.1 | |
|---|---|---|
| 0 | Daily SMA20 | 0.8570 |
| 1 | Daily SMA50 | 0.8582 |
| 2 | Daily SMA100 | 0.8627 |
| 3 | Daily SMA200 | 0.8712 |
The previous day high was 0.8578 while the previous day low was 0.8528. The daily 38.2% Fib levels comes at 0.8559, expected to provide support. Similarly, the daily 61.8% fib level is at 0.8547, expected to provide support.
Note the levels of interest below:
- Pivot support is noted at 0.8544, 0.8512, 0.8495
- Pivot resistance is noted at 0.8594, 0.8611, 0.8643
| Levels | Levels.1 |
|---|---|
| Previous Daily High | 0.8578 |
| Previous Daily Low | 0.8528 |
| Previous Weekly High | 0.8611 |
| Previous Weekly Low | 0.8548 |
| Previous Monthly High | 0.8669 |
| Previous Monthly Low | 0.8493 |
| Daily Fibonacci 38.2% | 0.8559 |
| Daily Fibonacci 61.8% | 0.8547 |
| Daily Pivot Point S1 | 0.8544 |
| Daily Pivot Point S2 | 0.8512 |
| Daily Pivot Point S3 | 0.8495 |
| Daily Pivot Point R1 | 0.8594 |
| Daily Pivot Point R2 | 0.8611 |
| Daily Pivot Point R3 | 0.8643 |
[/s2If]
Download Nehcap EAWe have two EAs that are operational on our LIVE accounts.
- EA-FIX: Check out the details here. Download EA-FIX . EA-FIX is a non-grid HFT scalper.
- EA-GROWTH: High quality low dd EA using trend grids. Download EA_GROWTHJoin Our Telegram Group
")


