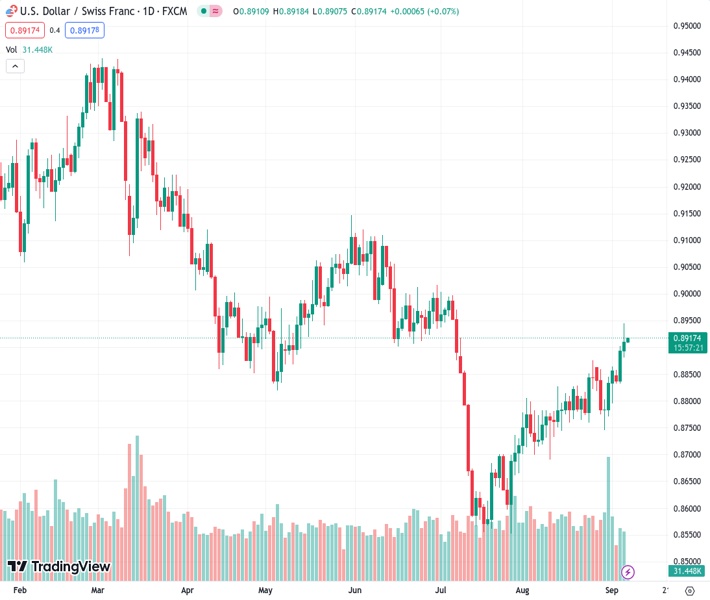
The bulls are having difficulty maintaining control at a two-month high for the USDCHF at 0.89175. According to @nehcap, a pullback is anticipated.
…
This is a premium post.
[s2If !current_user_can(access_s2member_level4)]Please register for FREE REGISTER to read full post below containing analysis. In case of any error or you think you are not able to read the full post below, please email us at support#nehcap.com [lwa][/s2If] [s2If current_user_can(access_s2member_level1)]
- USD/CHF bulls struggle to keep the reins at two-month high.
The pair currently trades last at 0.89175.
The previous day high was 0.8945 while the previous day low was 0.8881. The daily 38.2% Fib levels comes at 0.8921, expected to provide resistance. Similarly, the daily 61.8% fib level is at 0.8906, expected to provide support.
USD/CHF clings to mild gains around the highest levels in two months, lacks momentum near 0.8920 heading into Thursday’s European session during a three-day winning streak.
In doing so, the Swiss Franc (CHF) pair portrays the pair buyer’s struggle with a three-week-old rising resistance line amid the overbought RSI (14). However, a successful trading beyond the previous resistance line stretched from late May, as well as the 200-SMA keeps the bulls hopeful.
With this, the pair’s pullback towards the 0.8900 and then to the 50% Fibonacci retracement of May-July downside, near 0.8850 appears imminent.
A convergence of the 200-SMA and 38.2% Fibonacci ratio surrounding 0.8780 appears a tough nut to crack for the USD/CHF bears past 0.8850, a break of which will highlight the multi-day-old resistance-turned-support line of around 0.8720 as the last defense of the buyers.
On the flip side, a clear break of the aforementioned resistance line, close to 0.8930 needs validation from the recent peak surrounding 0.8945, as well as the Swiss Unemployment Rate for August, to convince the USD/CHF buyers.
Following that, a run-up towards the 0.9000 psychological magnet can’t be ruled out. Even so, the late June swing high of around 0.9020 may act as an extra filter toward the north.
Trend: Pullback expected
Technical Levels: Supports and Resistances
USDCHF currently trading at 0.8917 at the time of writing. Pair opened at 0.8912 and is trading with a change of 0.06% % .
| Overview | Overview.1 | |
|---|---|---|
| 0 | Today last price | 0.8917 |
| 1 | Today Daily Change | 0.0005 |
| 2 | Today Daily Change % | 0.06% |
| 3 | Today daily open | 0.8912 |
The pair is trading above its 20 Daily moving average @ 0.8816, above its 50 Daily moving average @ 0.8779 , above its 100 Daily moving average @ 0.8879 and below its 200 Daily moving average @ 0.9058
| Trends | Trends.1 | |
|---|---|---|
| 0 | Daily SMA20 | 0.8816 |
| 1 | Daily SMA50 | 0.8779 |
| 2 | Daily SMA100 | 0.8879 |
| 3 | Daily SMA200 | 0.9058 |
The previous day high was 0.8945 while the previous day low was 0.8881. The daily 38.2% Fib levels comes at 0.8921, expected to provide resistance. Similarly, the daily 61.8% fib level is at 0.8906, expected to provide support.
Note the levels of interest below:
- Pivot support is noted at 0.888, 0.8849, 0.8817
- Pivot resistance is noted at 0.8944, 0.8976, 0.9007
| Levels | Levels.1 |
|---|---|
| Previous Daily High | 0.8945 |
| Previous Daily Low | 0.8881 |
| Previous Weekly High | 0.8865 |
| Previous Weekly Low | 0.8745 |
| Previous Monthly High | 0.8876 |
| Previous Monthly Low | 0.8690 |
| Daily Fibonacci 38.2% | 0.8921 |
| Daily Fibonacci 61.8% | 0.8906 |
| Daily Pivot Point S1 | 0.8880 |
| Daily Pivot Point S2 | 0.8849 |
| Daily Pivot Point S3 | 0.8817 |
| Daily Pivot Point R1 | 0.8944 |
| Daily Pivot Point R2 | 0.8976 |
| Daily Pivot Point R3 | 0.9007 |
[/s2If]
Download Nehcap EAWe have two EAs that are operational on our LIVE accounts.
- EA-FIX: Check out the details here. Download EA-FIX . EA-FIX is a non-grid HFT scalper.
- EA-GROWTH: High quality low dd EA using trend grids. Download EA_GROWTHJoin Our Telegram Group
")


