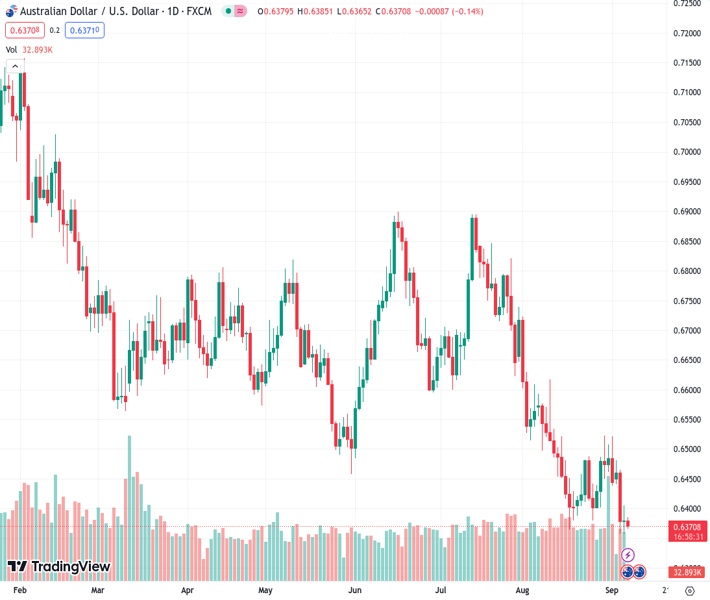
The Australian Dollar/US Dollar pair, currently trading at 0.63713, continues to be at a low level for the year and is being weakened by a variety of factors.
…
This is a premium post.
[s2If !current_user_can(access_s2member_level4)]Please register for FREE REGISTER to read full post below containing analysis. In case of any error or you think you are not able to read the full post below, please email us at support#nehcap.com [lwa][/s2If] [s2If current_user_can(access_s2member_level1)]
- AUD/USD remains depressed near the YTD low and is undermined by a combination of factors.
The pair currently trades last at 0.63713.
The previous day high was 0.6405 while the previous day low was 0.6357. The daily 38.2% Fib levels comes at 0.6387, expected to provide resistance. Similarly, the daily 61.8% fib level is at 0.6375, expected to provide resistance.
The AUD/USD pair struggles to gain any meaningful traction during the Asian session on Thursday and hovers just above its lowest level since November 2022 touched earlier this week. Spot prices currently trade around the 0.6370-0.6365 area and seem vulnerable to prolonging the recent well-established downtrend witnessed over the past two months or so.
The Australian Dollar (AUD) is undermined by weaker domestic data, which showed trade surplus shrank to $8.039 Billion in July as compared to $11.321 Billion in the previous month and $10.00 billion anticipated. Additional details revealed that Australia’s Goods/Services Exports declined by 2% on a monthly basis, while Imports rose by 3% in July as compared to the 4% fall recorded in the previous month. The data, meanwhile, fails to impress bulls or lend support to the AUD/USD pair amid concerns about the worsening economic conditions in China – Australia’s bigger trading partner.
The fears were further fueled by Chinese Trade Balance data for August, indicating that imports and exports fell 7.3% and 8.8% year on year, respectively, highlighting that manufacturers remain under pressure. The AUD/USD pair also reacts little to comments by the Reserve Bank of Australia (RBA) Governor Philip Lowe, reiterating the need to raise rates further if inflation becomes sticky. That said, the RBA’s on-hold decision for the third straight meeting on Tuesday and lack of fresh hawkish signals now seem to have convinced that the central bank is down with the policy tightening.
The US Dollar (USD), on the other hand, is seen consolidating its recent rally to a six-week high and holding back traders from placing fresh bearish bets around the AUD/USD pair. The near-term bias, however, remains tilted in favour of the USD bulls in the wake of rising bets for one more 25 bps rate hike by the Federal Reserve (Fed) in 2023. The bets were lifted by the upbeat US ISM Services PMI on Wednesday. This remains supportive of elevated US Treasury bond yields and validates the positive outlook for the USD, suggesting that the path of least resistance for the pair is to the downside.
Technical Levels: Supports and Resistances
AUDUSD currently trading at 0.6372 at the time of writing. Pair opened at 0.638 and is trading with a change of -0.13 % .
| Overview | Overview.1 | |
|---|---|---|
| 0 | Today last price | 0.6372 |
| 1 | Today Daily Change | -0.0008 |
| 2 | Today Daily Change % | -0.1300 |
| 3 | Today daily open | 0.6380 |
The pair remains strongly bearish on the daily time frame. It trades below the 20 SMA @ 0.6444, 50 SMA 0.6591, 100 SMA @ 0.6634 and 200 SMA @ 0.6717.
| Trends | Trends.1 | |
|---|---|---|
| 0 | Daily SMA20 | 0.6444 |
| 1 | Daily SMA50 | 0.6591 |
| 2 | Daily SMA100 | 0.6634 |
| 3 | Daily SMA200 | 0.6717 |
The previous day high was 0.6405 while the previous day low was 0.6357. The daily 38.2% Fib levels comes at 0.6387, expected to provide resistance. Similarly, the daily 61.8% fib level is at 0.6375, expected to provide resistance.
Note the levels of interest below:
- Pivot support is noted at 0.6356, 0.6333, 0.6309
- Pivot resistance is noted at 0.6404, 0.6428, 0.6451
| Levels | Levels.1 |
|---|---|
| Previous Daily High | 0.6405 |
| Previous Daily Low | 0.6357 |
| Previous Weekly High | 0.6522 |
| Previous Weekly Low | 0.6401 |
| Previous Monthly High | 0.6724 |
| Previous Monthly Low | 0.6364 |
| Daily Fibonacci 38.2% | 0.6387 |
| Daily Fibonacci 61.8% | 0.6375 |
| Daily Pivot Point S1 | 0.6356 |
| Daily Pivot Point S2 | 0.6333 |
| Daily Pivot Point S3 | 0.6309 |
| Daily Pivot Point R1 | 0.6404 |
| Daily Pivot Point R2 | 0.6428 |
| Daily Pivot Point R3 | 0.6451 |
[/s2If]
Download Nehcap EAWe have two EAs that are operational on our LIVE accounts.
- EA-FIX: Check out the details here. Download EA-FIX . EA-FIX is a non-grid HFT scalper.
- EA-GROWTH: High quality low dd EA using trend grids. Download EA_GROWTHJoin Our Telegram Group
")


