The Australian dollar to US dollar exchange rate remains steady at 0.6375, after initially being at 0.63783. This comes as Australia reports a trade surplus of A$8 billion for July, which falls below expectations and causes a decrease in investor confidence.
…
This is a premium post.
[s2If !current_user_can(access_s2member_level4)]Please register for FREE REGISTER to read full post below containing analysis. In case of any error or you think you are not able to read the full post below, please email us at support#nehcap.com [lwa][/s2If] [s2If current_user_can(access_s2member_level1)]
- AUD/USD trades flat at 0.6375 as Australia posts a trade surplus of A$8 billion in July, missing estimates and sparking risk-off sentiment.
The pair currently trades last at 0.63783.
The previous day high was 0.6405 while the previous day low was 0.6357. The daily 38.2% Fib levels comes at 0.6387, expected to provide resistance. Similarly, the daily 61.8% fib level is at 0.6375, expected to provide support.
The Aussie Dollar (AUD) pared its losses versus the US Dollar (USD) on Thursday after US economic data showed the US Federal Reserve (Fed) work is far from done, while weakness in China’s exports weighed the market mood. At the time of writing, the AUD/USD is trading at 0.6375, flat as Friday’s Asian session commences.
Australia’s economic docket showed that Imports surpassed Exports, but still, it showed a surplus on its Trade Balance of A$8 billion in July. Although the data is encouraging, missed estimates. That, alongside a weaker improvement of China’s exports, spurred a risk-off impulse that carried on throughout the whole trading day, with Wall Street finishing with losses, except for the Dow Jones, witnessing decent gains of 0.22%.
Aside from this, US economic data revealed by the US Department of Labor reinforced the Federal Reserve’s need to hold rates higher for longer, as said by its Chairman Jerome Powell. Unemployment claims for the last week rose by 216K, below estimates, while Continuing Claims gave signals that conditions are tightening.
The data bolstered the US Dollar (USD), which, as shown by the US Dollar Index, printed gains of 0.20%, standing near yearly highs above 105.000. Therefore, the AUD/USD was downward pressure near the 0.6350s area.
Meanwhile, US Treasury bond yields retreated somewhat, as money market futures slashed bets the US Federal Reserve would continue to tighten monetary policy, past the current Federal Funds Rate (FFR) at 5.25%-5.50%, Odds for a 25 bps rate hike in November, are at 43.4%.
Recently, Federal Reserve officials have kept their options open regarding deciding the forward path of monetary policy. John Williams from the New York Fed said that policy is “restrictive” but refrained from commenting on his decision. Of late, Chicago’s Fed President Austan Goolsbee said the Fed could reach the “golden path” where inflation falls but recession is avoided.
AUD/USD traders should be attentive to next week’s data. The Australian economic docket would feature the Westpac Consumer Confidence, NAB Business Confidence, and employment data. On the US front, inflation figures, Retail Sales, Industrial Production, unemployment claims and Consumer Sentiment would shed some light regarding the Fed’s future decision.
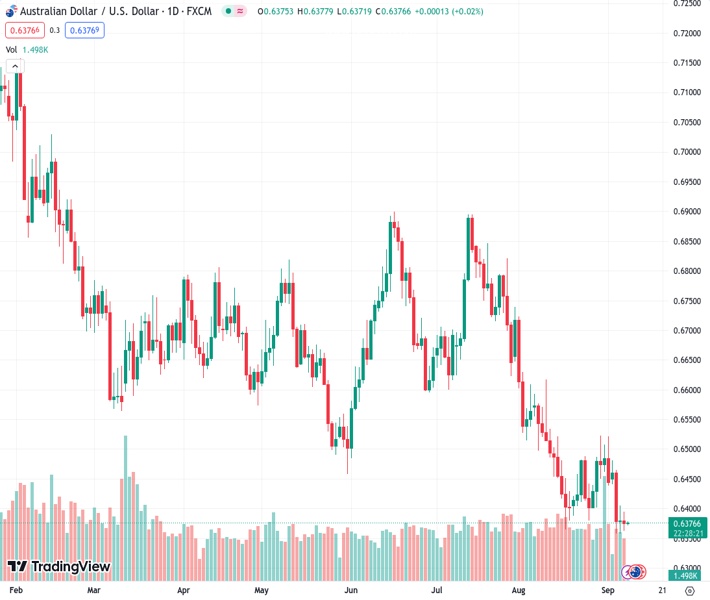
The daily chart portrays the pair subdued at around the year lows of 0.6357, printing back-to-back sessions of spinning tops, suggesting that neither buyers nor sellers are in charge. However, the trend remains downward, and if the AUD/USD drops below 0.6357, expect a challenge of the 0.6300 figure. Once cleared, the major would test the November 22 low of 0.6272. On the flip side, upside risks emerge above the September 6 high of 0.6405, with the next resistance at the September 5 high at 0.6464.
Technical Levels: Supports and Resistances
AUDUSD currently trading at 0.6378 at the time of writing. Pair opened at 0.638 and is trading with a change of -0.03 % .
| Overview | Overview.1 | |
|---|---|---|
| 0 | Today last price | 0.6378 |
| 1 | Today Daily Change | -0.0002 |
| 2 | Today Daily Change % | -0.0300 |
| 3 | Today daily open | 0.6380 |
The pair remains strongly bearish on the daily time frame. It trades below the 20 SMA @ 0.6444, 50 SMA 0.6591, 100 SMA @ 0.6634 and 200 SMA @ 0.6717.
| Trends | Trends.1 | |
|---|---|---|
| 0 | Daily SMA20 | 0.6444 |
| 1 | Daily SMA50 | 0.6591 |
| 2 | Daily SMA100 | 0.6634 |
| 3 | Daily SMA200 | 0.6717 |
The previous day high was 0.6405 while the previous day low was 0.6357. The daily 38.2% Fib levels comes at 0.6387, expected to provide resistance. Similarly, the daily 61.8% fib level is at 0.6375, expected to provide support.
Note the levels of interest below:
- Pivot support is noted at 0.6356, 0.6333, 0.6309
- Pivot resistance is noted at 0.6404, 0.6428, 0.6451
| Levels | Levels.1 |
|---|---|
| Previous Daily High | 0.6405 |
| Previous Daily Low | 0.6357 |
| Previous Weekly High | 0.6522 |
| Previous Weekly Low | 0.6401 |
| Previous Monthly High | 0.6724 |
| Previous Monthly Low | 0.6364 |
| Daily Fibonacci 38.2% | 0.6387 |
| Daily Fibonacci 61.8% | 0.6375 |
| Daily Pivot Point S1 | 0.6356 |
| Daily Pivot Point S2 | 0.6333 |
| Daily Pivot Point S3 | 0.6309 |
| Daily Pivot Point R1 | 0.6404 |
| Daily Pivot Point R2 | 0.6428 |
| Daily Pivot Point R3 | 0.6451 |
[/s2If]
Download Nehcap EAWe have two EAs that are operational on our LIVE accounts.
- EA-FIX: Check out the details here. Download EA-FIX . EA-FIX is a non-grid HFT scalper.
- EA-GROWTH: High quality low dd EA using trend grids. Download EA_GROWTHJoin Our Telegram Group
")


