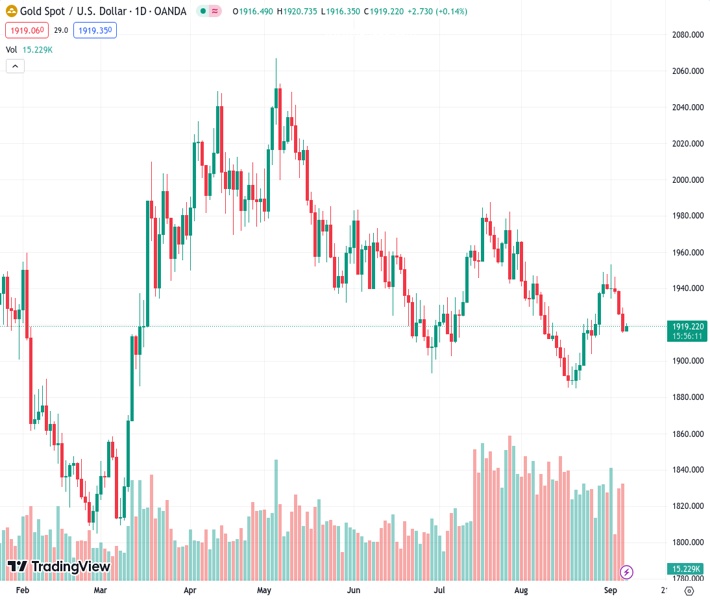
Despite the US Dollar (USD) gaining strength, the price of gold, denoted as #XAUUSD and currently at 1,919.13, is experiencing an upward trend.
…
This is a premium post.
[s2If !current_user_can(access_s2member_level4)]Please register for FREE REGISTER to read full post below containing analysis. In case of any error or you think you are not able to read the full post below, please email us at support#nehcap.com [lwa][/s2If] [s2If current_user_can(access_s2member_level1)]
- Gold price trades higher despite firmer US Dollar (USD).
The pair currently trades last at 1919.13.
The previous day high was 1929.21 while the previous day low was 1915.33. The daily 38.2% Fib levels comes at 1920.63, expected to provide resistance. Similarly, the daily 61.8% fib level is at 1923.91, expected to provide resistance.
Gold price snaps five-day losing streak, trading higher around $1,920, up by 0.20% during the Asian session on Thursday. However, the bright metal is facing downward pressure as traders factor in the odds for a 25 basis points (bps) interest rate hike by the US Federal Reserve (Fed) through the end of the year 2023.
The hawkish sentiment surrounding the Fed policy decision in the upcoming meeting in September, is continues to support the US Treasury yields. This reinforces the confidence of US Dollar (USD) bulls. The 10-year US bond yield rose to 4.28%, up by 0.05% at the time of writing. US Dollar Index (DXY) hovers around 104.80, which measures the value of the Greenback against the six other major currencies.
Additionally, US ISM Services PMI rose to a six-month high reading of 54.5 in August against the expectations of 52.5 and 52.7 prior. While the S&P Global Composite and Services PMIs fell to 50.2 and 50.5 compared to the market consensus of 50.4 and 51.0. It is worth noting that moderate US data provided support in underpinning the buck.
Investor sentiment remains dampened due to worries over the deteriorating economic situation in China and the ongoing trade tensions between the United States and China. These factors are casting a shadow over the minds of investors and undermining the Gold price.
However, it is worth noting that the bearish tone prevailing in the equity markets might offer some limited support to the price of precious metal, given a safe-haven status.
The trade tensions between the US and China escalated, which could act as headwinds for the price of yellow metal. As per Reuters, US Commerce Secretary Gina Raimondo said no revision is expected on US tariffs which were imposed on China during Trump’s administration, until the ongoing review by the US Treasury Office is completed.
Technical Levels: Supports and Resistances
XAUUSD currently trading at 1919.82 at the time of writing. Pair opened at 1916.76 and is trading with a change of 0.16 % .
| Overview | Overview.1 | |
|---|---|---|
| 0 | Today last price | 1919.82 |
| 1 | Today Daily Change | 3.06 |
| 2 | Today Daily Change % | 0.16 |
| 3 | Today daily open | 1916.76 |
The pair is trading above its 20 Daily moving average @ 1915.35, below its 50 Daily moving average @ 1932.0 , below its 100 Daily moving average @ 1952.15 and above its 200 Daily moving average @ 1917.55
| Trends | Trends.1 | |
|---|---|---|
| 0 | Daily SMA20 | 1915.35 |
| 1 | Daily SMA50 | 1932.00 |
| 2 | Daily SMA100 | 1952.15 |
| 3 | Daily SMA200 | 1917.55 |
The previous day high was 1929.21 while the previous day low was 1915.33. The daily 38.2% Fib levels comes at 1920.63, expected to provide resistance. Similarly, the daily 61.8% fib level is at 1923.91, expected to provide resistance.
Note the levels of interest below:
- Pivot support is noted at 1911.66, 1906.55, 1897.78
- Pivot resistance is noted at 1925.54, 1934.31, 1939.42
| Levels | Levels.1 |
|---|---|
| Previous Daily High | 1929.21 |
| Previous Daily Low | 1915.33 |
| Previous Weekly High | 1953.01 |
| Previous Weekly Low | 1912.84 |
| Previous Monthly High | 1966.08 |
| Previous Monthly Low | 1884.85 |
| Daily Fibonacci 38.2% | 1920.63 |
| Daily Fibonacci 61.8% | 1923.91 |
| Daily Pivot Point S1 | 1911.66 |
| Daily Pivot Point S2 | 1906.55 |
| Daily Pivot Point S3 | 1897.78 |
| Daily Pivot Point R1 | 1925.54 |
| Daily Pivot Point R2 | 1934.31 |
| Daily Pivot Point R3 | 1939.42 |
[/s2If]
Download Nehcap EAWe have two EAs that are operational on our LIVE accounts.
- EA-FIX: Check out the details here. Download EA-FIX . EA-FIX is a non-grid HFT scalper.
- EA-GROWTH: High quality low dd EA using trend grids. Download EA_GROWTHJoin Our Telegram Group
")


