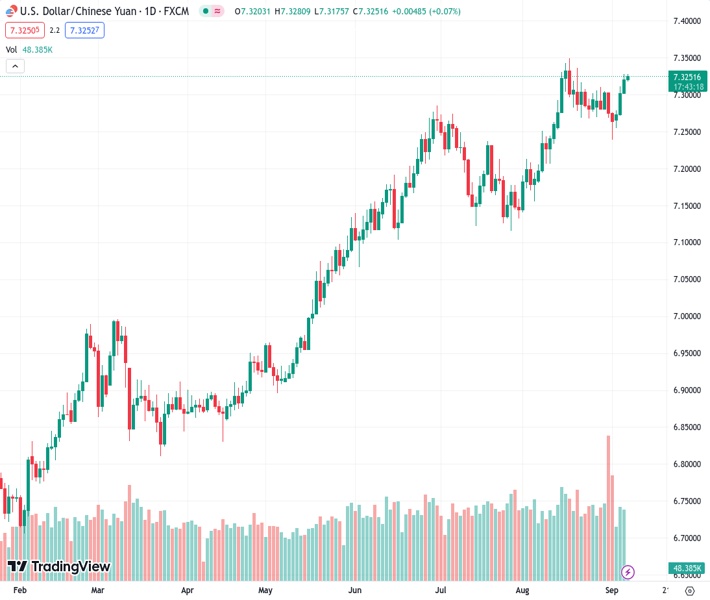
Despite positive news regarding imports and exports, the USDCNH exchange rate remains strong at its highest level in two weeks, due to a worsening trade balance.
…
This is a premium post.
[s2If !current_user_can(access_s2member_level4)]Please register for FREE REGISTER to read full post below containing analysis. In case of any error or you think you are not able to read the full post below, please email us at support#nehcap.com [lwa][/s2If] [s2If current_user_can(access_s2member_level1)]
- USD/CNH remains firmer at two-week high despite upbeat Imports, Exports as Trade Balance deteriorates.
The pair currently trades last at 7.32598.
The previous day high was 7.3278 while the previous day low was 7.3016. The daily 38.2% Fib levels comes at 7.3178, expected to provide support. Similarly, the daily 61.8% fib level is at 7.3117, expected to provide support.
USD/CNH rises to 7.3265 while picking up bids to revisit the fortnight high marked earlier in the day after China reported mixed foreign trade data for August on early Thursday.
That said, China’s headline Trade Balance eased to $68.3 billion in August from $80.6 billion, versus $73.9 billion prior whereas the Exports and Imports for the said month improved to -8.8% YoY and -7.3% YoY respectively versus -14.5% and -12.4% priors in that order.
With this, the Chinese trade numbers join the early-week disappointment via China Caixin Services PMI, as well as the market’s lack of confidence in the Dragon Nation’s stimulus, to propel the offshore Chinese Yuan (CNH) pair. On the same line could be the US-China tension surrounding the trade conditions and Taiwan. Furthermore, the latest economics from the Eurozone and the UK, as well as statements from the European Central Bank (ECB) and the Bank of England (BoE) officials, have been portraying a downbeat economic picture of the Eurozone and Britain and contributing to the risk aversion, which in turn propels the US Dollar.
On the contrary, strong US activity and output data join the hawkish Federal Reserve (Fed) signals to highlight the US Dollar as the market’s favorite. On the same line could be the Fed’s Beige Book suggesting a soft landing in the US.
Against this backdrop, S&P 500 Futures remain pressured at the lowest level in a week, down for the fourth consecutive day while posting mild losses around 4,468 by the press time. That said, the US 10-year Treasury bond yields seesaw near the two-week high registered the previous day around 4.30%, near 4.29% at the latest, whereas the two-year counterpart prints the first daily loss in four by retreating from the weekly top to 5.01% as we write. With this, the US Dollar Index (DXY) struggled at the highest level in six months, indecisive at 104.85 at the latest
Having witnessed another downbeat clue for China’s economy, the USD/CNH traders should wait for the second-tier US employment and activity data, as well as speeches from a slew of Fed policymakers for clear directions.
USD/CNH remains on the way to refreshing the yearly top marked in August surrounding 7.3500 unless it drops below a three-week-long previous resistance line of near 7.2830.
Technical Levels: Supports and Resistances
USDCNH currently trading at 7.3274 at the time of writing. Pair opened at 7.3204 and is trading with a change of 0.10% % .
| Overview | Overview.1 | |
|---|---|---|
| 0 | Today last price | 7.3274 |
| 1 | Today Daily Change | 0.0070 |
| 2 | Today Daily Change % | 0.10% |
| 3 | Today daily open | 7.3204 |
The pair remains strongly bullish on the daily timeframe. It trades above its 20 SMA @ 7.2919, 50 SMA 7.2371, 100 SMA @ 7.1461 and 200 SMA @ 7.0138.
| Trends | Trends.1 | |
|---|---|---|
| 0 | Daily SMA20 | 7.2919 |
| 1 | Daily SMA50 | 7.2371 |
| 2 | Daily SMA100 | 7.1461 |
| 3 | Daily SMA200 | 7.0138 |
The previous day high was 7.3278 while the previous day low was 7.3016. The daily 38.2% Fib levels comes at 7.3178, expected to provide support. Similarly, the daily 61.8% fib level is at 7.3117, expected to provide support.
Note the levels of interest below:
- Pivot support is noted at 7.3054, 7.2905, 7.2793
- Pivot resistance is noted at 7.3316, 7.3428, 7.3578
| Levels | Levels.1 |
|---|---|
| Previous Daily High | 7.3278 |
| Previous Daily Low | 7.3016 |
| Previous Weekly High | 7.3106 |
| Previous Weekly Low | 7.2390 |
| Previous Monthly High | 7.3496 |
| Previous Monthly Low | 7.1452 |
| Daily Fibonacci 38.2% | 7.3178 |
| Daily Fibonacci 61.8% | 7.3117 |
| Daily Pivot Point S1 | 7.3054 |
| Daily Pivot Point S2 | 7.2905 |
| Daily Pivot Point S3 | 7.2793 |
| Daily Pivot Point R1 | 7.3316 |
| Daily Pivot Point R2 | 7.3428 |
| Daily Pivot Point R3 | 7.3578 |
[/s2If]
Download Nehcap EAWe have two EAs that are operational on our LIVE accounts.
- EA-FIX: Check out the details here. Download EA-FIX . EA-FIX is a non-grid HFT scalper.
- EA-GROWTH: High quality low dd EA using trend grids. Download EA_GROWTHJoin Our Telegram Group
")


