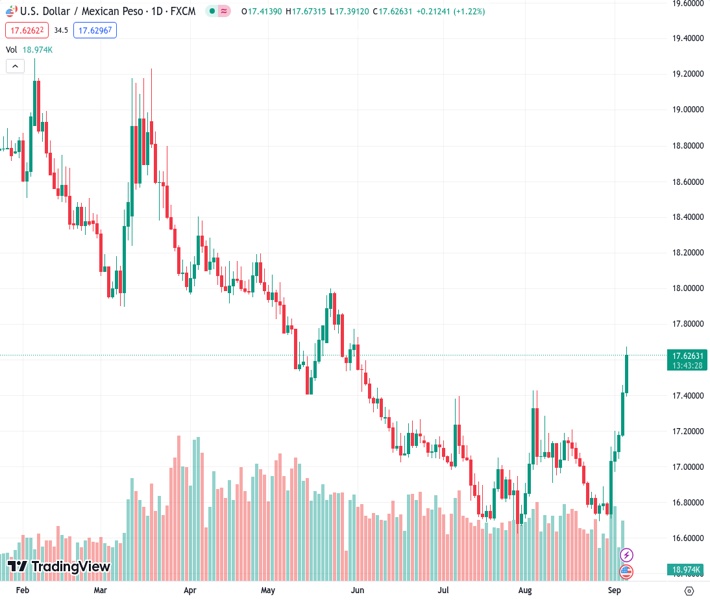
The USDMXN currency pair is showing consistent upward movement for the fourth consecutive day and remains above the 50- and 100-day Exponential Moving Averages (EMAs) on the daily chart.
…
This is a premium post.
[s2If !current_user_can(access_s2member_level4)]Please register for FREE REGISTER to read full post below containing analysis. In case of any error or you think you are not able to read the full post below, please email us at support#nehcap.com [lwa][/s2If] [s2If current_user_can(access_s2member_level1)]
- USD/MXN gains momentum for the fourth straight day, holds above the 50- and 100-day EMAs on the daily chart.
The pair currently trades last at 17.6460.
The previous day high was 17.4582 while the previous day low was 17.1704. The daily 38.2% Fib levels comes at 17.3483, expected to provide support. Similarly, the daily 61.8% fib level is at 17.2803, expected to provide support.
The Mexican Peso (MXN) trades in negative territory for the fourth consecutive day against the US Dollar (USD). USD/MXN currently trades near 17.50, gaining 0.48% on the day.
From the technical perspective, USD/MXN just holds above the 50- and 100-day Exponential Moving Averages (EMAs) on the daily chart, which means the path of the least resistance is to the upside. Meanwhile, the Relative Strength Index (RSI) stands above 50 and the Moving Average Convergence/Divergence (MACD) is located within the bullish territory, suggesting that buyers the further upside looks favorable for the time being.
Therefore, the pair could meet the immediate resistance level at 17.77 (a high of May 31). The additional upside filter to watch is near a psychological round mark and a high of May 24 at 18.00. Further north, the next barrier is seen at 18.20 (a high of April 27) and finally at 18.40 (a high of April 5).
On the downside, the first support level is seen at 17.35, representing the 50-day EMA. Any extended weakness below the latter will challenge the critical contention at the 17.00-17.10 region. The mentioned level is a confluence of the midline of Bollinger Band, a psychological round figure, and the 50-day EMA. The next downside stop to watch is near a Year-To-Date (YTD) low of 16.60. Further south, the pair will see a drop to a psychological round figure at 16.00.
Technical Levels: Supports and Resistances
USDMXN currently trading at 17.4969 at the time of writing. Pair opened at 17.4171 and is trading with a change of 0.46 % .
| Overview | Overview.1 | |
|---|---|---|
| 0 | Today last price | 17.4969 |
| 1 | Today Daily Change | 0.0798 |
| 2 | Today Daily Change % | 0.4600 |
| 3 | Today daily open | 17.4171 |
The pair is trading above its 20 Daily moving average @ 17.0031, above its 50 Daily moving average @ 16.9795 , above its 100 Daily moving average @ 17.29 and below its 200 Daily moving average @ 18.045
| Trends | Trends.1 | |
|---|---|---|
| 0 | Daily SMA20 | 17.0031 |
| 1 | Daily SMA50 | 16.9795 |
| 2 | Daily SMA100 | 17.2900 |
| 3 | Daily SMA200 | 18.0450 |
The previous day high was 17.4582 while the previous day low was 17.1704. The daily 38.2% Fib levels comes at 17.3483, expected to provide support. Similarly, the daily 61.8% fib level is at 17.2803, expected to provide support.
Note the levels of interest below:
- Pivot support is noted at 17.2389, 17.0607, 16.9511
- Pivot resistance is noted at 17.5268, 17.6364, 17.8146
| Levels | Levels.1 |
|---|---|
| Previous Daily High | 17.4582 |
| Previous Daily Low | 17.1704 |
| Previous Weekly High | 17.2025 |
| Previous Weekly Low | 16.6945 |
| Previous Monthly High | 17.4274 |
| Previous Monthly Low | 16.6945 |
| Daily Fibonacci 38.2% | 17.3483 |
| Daily Fibonacci 61.8% | 17.2803 |
| Daily Pivot Point S1 | 17.2389 |
| Daily Pivot Point S2 | 17.0607 |
| Daily Pivot Point S3 | 16.9511 |
| Daily Pivot Point R1 | 17.5268 |
| Daily Pivot Point R2 | 17.6364 |
| Daily Pivot Point R3 | 17.8146 |
[/s2If]
Download Nehcap EAWe have two EAs that are operational on our LIVE accounts.
- EA-FIX: Check out the details here. Download EA-FIX . EA-FIX is a non-grid HFT scalper.
- EA-GROWTH: High quality low dd EA using trend grids. Download EA_GROWTHJoin Our Telegram Group
")


