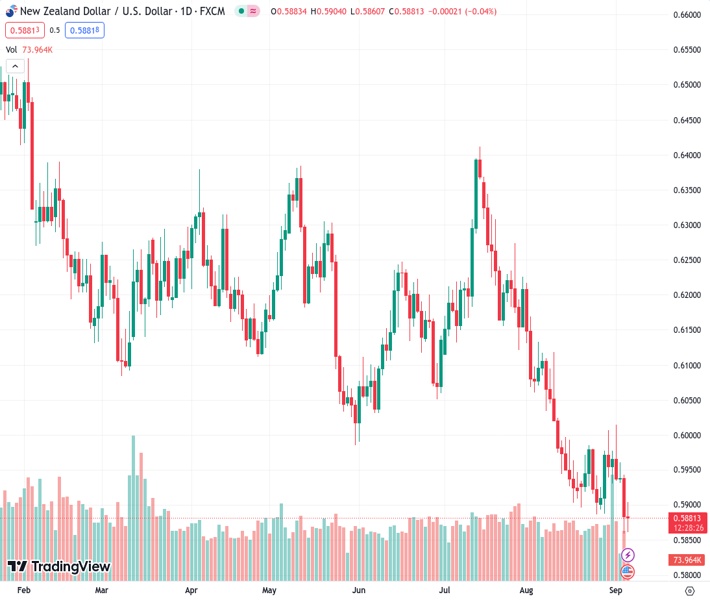
The NZD/USD pair, currently at 0.58801, is facing difficulty in reaching the 0.5900 level as it prepares for the release of the US PMI data.
…
This is a premium post.
[s2If !current_user_can(access_s2member_level4)]Please register for FREE REGISTER to read full post below containing analysis. In case of any error or you think you are not able to read the full post below, please email us at support#nehcap.com [lwa][/s2If] [s2If current_user_can(access_s2member_level1)]
- NZD/USD struggles to approach 0.5900 ahead of the US PMI releases.
The pair currently trades last at 0.58801.
The previous day high was 0.595 while the previous day low was 0.5859. The daily 38.2% Fib levels comes at 0.5894, expected to provide resistance. Similarly, the daily 61.8% fib level is at 0.5916, expected to provide resistance.
NZD/USD grapples to snap the losing streak that began on Friday, holding grounds near 0.5880 during the European session on Wednesday. The strength in the US Dollar (USD) weighed on the pair as market participants anticipate the Federal Reserve (Fed) to keep interest rates at a higher level for a prolonged period.
Furthermore, the markets are pricing in the possibility of a 25 basis points (bps) rate hike by the end of 2023. This hawkish outlook continues to underpin the yields on the US Treasury bonds, which provides confidence to the Greenback’s buyers.
The resurgence of trade tensions between the US and China could potentially reinforce the fears over China’s gloomy economic outlook. US Commerce Secretary Gina Raimondo anticipates that there will be no revisions to the US tariffs on China, which were imposed during Trump’s administration until the ongoing review by the US Treasury Office is completed.
Given the close trade relationship between China and New Zealand, this situation may potentially exert downward pressure on the New Zealand Dollar (NZD) due to its susceptibility to developments in the Chinese economy.
US Dollar Index (DXY), which measures the value of the US Dollar (USD) against the six other major currencies, hovers around 104.70 at the time of writing. The yield on the 10-year US Treasury bond rose to 4.26%, up by 1.90%, which is contributing the support in underpinning the US Dollar (USD).
Investors will closely monitor the forthcoming economic data from the United States (US). The release of the US ISM Services PMI for August and the US S&P Global PMIs later in the North American session will be significant. These data releases will provide valuable insights into the current economic conditions in the United States and could potentially offer a clearer direction for the NZD/JPY currency pair.
Technical Levels: Supports and Resistances
NZDUSD currently trading at 0.588 at the time of writing. Pair opened at 0.5883 and is trading with a change of -0.05 % .
| Overview | Overview.1 | |
|---|---|---|
| 0 | Today last price | 0.5880 |
| 1 | Today Daily Change | -0.0003 |
| 2 | Today Daily Change % | -0.0500 |
| 3 | Today daily open | 0.5883 |
The pair remains strongly bearish on the daily time frame. It trades below the 20 SMA @ 0.5951, 50 SMA 0.6093, 100 SMA @ 0.6132 and 200 SMA @ 0.6218.
| Trends | Trends.1 | |
|---|---|---|
| 0 | Daily SMA20 | 0.5951 |
| 1 | Daily SMA50 | 0.6093 |
| 2 | Daily SMA100 | 0.6132 |
| 3 | Daily SMA200 | 0.6218 |
The previous day high was 0.595 while the previous day low was 0.5859. The daily 38.2% Fib levels comes at 0.5894, expected to provide resistance. Similarly, the daily 61.8% fib level is at 0.5916, expected to provide resistance.
Note the levels of interest below:
- Pivot support is noted at 0.5844, 0.5806, 0.5753
- Pivot resistance is noted at 0.5936, 0.5989, 0.6028
| Levels | Levels.1 |
|---|---|
| Previous Daily High | 0.5950 |
| Previous Daily Low | 0.5859 |
| Previous Weekly High | 0.6015 |
| Previous Weekly Low | 0.5887 |
| Previous Monthly High | 0.6219 |
| Previous Monthly Low | 0.5885 |
| Daily Fibonacci 38.2% | 0.5894 |
| Daily Fibonacci 61.8% | 0.5916 |
| Daily Pivot Point S1 | 0.5844 |
| Daily Pivot Point S2 | 0.5806 |
| Daily Pivot Point S3 | 0.5753 |
| Daily Pivot Point R1 | 0.5936 |
| Daily Pivot Point R2 | 0.5989 |
| Daily Pivot Point R3 | 0.6028 |
[/s2If]
Download Nehcap EAWe have two EAs that are operational on our LIVE accounts.
- EA-FIX: Check out the details here. Download EA-FIX . EA-FIX is a non-grid HFT scalper.
- EA-GROWTH: High quality low dd EA using trend grids. Download EA_GROWTHJoin Our Telegram Group
")


