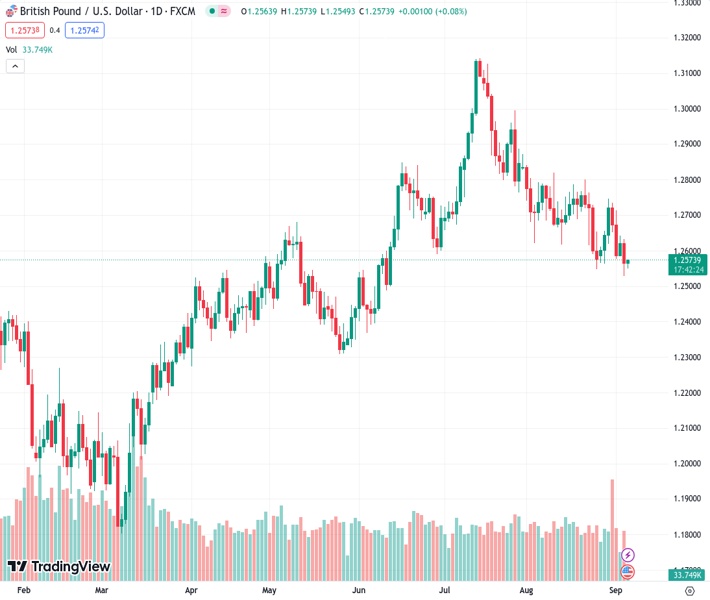
The GBPUSD currency pair is fluctuating within a range slightly higher than its lowest point since June 13, which was reached on Tuesday.
…
This is a premium post.
[s2If !current_user_can(access_s2member_level4)]Please register for FREE REGISTER to read full post below containing analysis. In case of any error or you think you are not able to read the full post below, please email us at support#nehcap.com [lwa][/s2If] [s2If current_user_can(access_s2member_level1)]
- GBP/USD oscillates in a range just above its lowest level since June 13 touched on Tuesday.
The pair currently trades last at 1.25702.
The previous day high was 1.2632 while the previous day low was 1.2528. The daily 38.2% Fib levels comes at 1.2568, expected to provide support. Similarly, the daily 61.8% fib level is at 1.2592, expected to provide resistance.
The GBP/USD pair struggles to capitalize on the overnight modest bounce from the 1.2530-1.2525 region, or its lowest level since June 13 and oscillates in a narrow trading band through the Asian session on Wednesday. Spot prices currently hover around the 1.2570 region, up less than 0.10% for the day, and remain at the mercy of the US Dollar (USD) price dynamics.
The USD Index (DXY), which tracks the Greenback against a basket of currencies, consolidate its recent move up to a nearly six-month top, which, in turn, is seen as a key factor acting as a tailwind for the GBP/USD pair. Apart from this, expectations that the Bank of England (BoE) will continue with its policy tightening cycle to combat high inflation lends some support to the British Pound (GBP). In fact, money market futures indicate over 85% chance that the BoE will hike interest rates by 25 bps, for the fifteenth time in September.
That said, looming recession risks might hold back traders from placing aggressive bullish bets around the GBP. Furthermore, growing acceptance that the Federal Reserve (Fed) will keep interest rates higher for longer should continue to act as a tailwind for the Greenback and contribute to limiting the upside for the GBP/USD pair. In fact, the markets are still pricing in the possibility of one more 25 bps Fed rate hike move by the end of this year, which remains supportive of elevated US Treasury bond yields and favours the USD bulls.
The aforementioned fundamental backdrop suggests that the path of least resistance for the GBP/USD pair is to the downside and any attempted recovery might still be seen as a selling opportunity. Market participants now look to the BoE Monetary Policy Report Hearings, where comments by Governor Andrew Bailey and several MPC members should influence the Sterling Pound. Later during the early North American session, traders will take cues from the US ISM Services PMI to grab short-term opportunities around the pair.
Technical Levels: Supports and Resistances
GBPUSD currently trading at 1.2573 at the time of writing. Pair opened at 1.2564 and is trading with a change of 0.07 % .
| Overview | Overview.1 | |
|---|---|---|
| 0 | Today last price | 1.2573 |
| 1 | Today Daily Change | 0.0009 |
| 2 | Today Daily Change % | 0.0700 |
| 3 | Today daily open | 1.2564 |
The pair is trading below its 20 Daily moving average @ 1.2675, below its 50 Daily moving average @ 1.2771 , below its 100 Daily moving average @ 1.2654 and above its 200 Daily moving average @ 1.2422
| Trends | Trends.1 | |
|---|---|---|
| 0 | Daily SMA20 | 1.2675 |
| 1 | Daily SMA50 | 1.2771 |
| 2 | Daily SMA100 | 1.2654 |
| 3 | Daily SMA200 | 1.2422 |
The previous day high was 1.2632 while the previous day low was 1.2528. The daily 38.2% Fib levels comes at 1.2568, expected to provide support. Similarly, the daily 61.8% fib level is at 1.2592, expected to provide resistance.
Note the levels of interest below:
- Pivot support is noted at 1.2518, 1.2471, 1.2414
- Pivot resistance is noted at 1.2621, 1.2678, 1.2725
| Levels | Levels.1 |
|---|---|
| Previous Daily High | 1.2632 |
| Previous Daily Low | 1.2528 |
| Previous Weekly High | 1.2746 |
| Previous Weekly Low | 1.2563 |
| Previous Monthly High | 1.2841 |
| Previous Monthly Low | 1.2548 |
| Daily Fibonacci 38.2% | 1.2568 |
| Daily Fibonacci 61.8% | 1.2592 |
| Daily Pivot Point S1 | 1.2518 |
| Daily Pivot Point S2 | 1.2471 |
| Daily Pivot Point S3 | 1.2414 |
| Daily Pivot Point R1 | 1.2621 |
| Daily Pivot Point R2 | 1.2678 |
| Daily Pivot Point R3 | 1.2725 |
[/s2If]
Download Nehcap EAWe have two EAs that are operational on our LIVE accounts.
- EA-FIX: Check out the details here. Download EA-FIX . EA-FIX is a non-grid HFT scalper.
- EA-GROWTH: High quality low dd EA using trend grids. Download EA_GROWTHJoin Our Telegram Group
")


