The GBPJPY currency pair, currently valued at 184.617, has declined to 184.70, representing a decrease of 0.56%. This drop in value can be attributed to an atmosphere of increased risk aversion and concerns that Japanese officials may intervene in the market.
…
This is a premium post.
[s2If !current_user_can(access_s2member_level4)]Please register for FREE REGISTER to read full post below containing analysis. In case of any error or you think you are not able to read the full post below, please email us at support#nehcap.com [lwa][/s2If] [s2If current_user_can(access_s2member_level1)]
- GBP/JPY trades lower at 184.70, down 0.56%, amid a risk-off environment and potential intervention threats from Japanese authorities.
The pair currently trades last at 184.617.
The previous day high was 185.78 while the previous day low was 184.08. The daily 38.2% Fib levels comes at 185.13, expected to provide resistance. Similarly, the daily 61.8% fib level is at 184.73, expected to provide resistance.
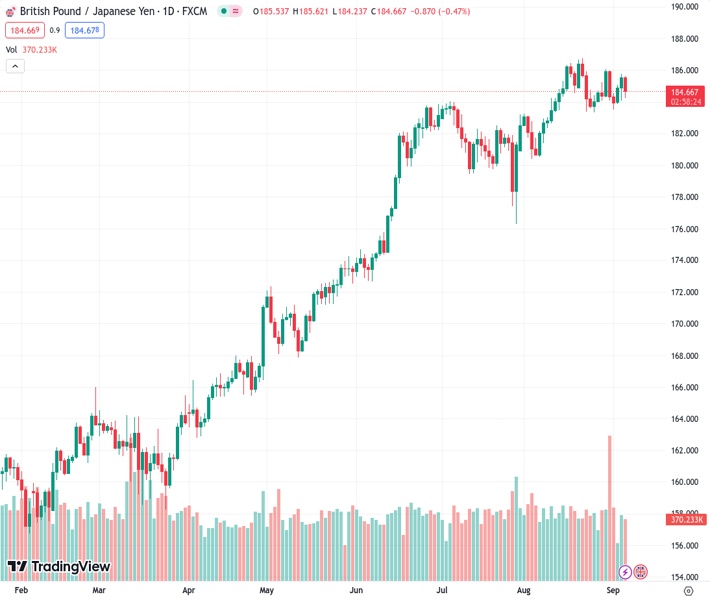
The Pound Sterling (GBP) losses steam against the Japanese Yen (JPY) after threats of a possible intervention by Japanese authorities. Also, a report from yesterday portraying a global economic slowdown triggered a risk-off impulse, favoring the Yen’s safe-haven status. The GBP/JPY is trading at 184.70, down 0.56%, after hitting a daily high of 185.62.
The daily chart depicts the cross as upward biased, but of late, the GBP/JPY has printed a successive series of lower highs but failed to print lower lows. Hence, the pair is trading sideways, at the brisk of breaking support formed during the last three weeks at around 183.35. If buyers reclaim last week’s high of 186.06, expect a retest of the year-to-date (YTD) high of 186.76. Conversely, a drop towards the top of the Ichimoku Cloud (Kumo), at around 179.96, is possible.
On an intraday basis, the GBP/JPY has broken below the Kumo, turning bearish, but its fall was cushioned by the S1 daily pivot point at 184.48. Once cleared, the next support would be the September 5 daily low of 184.07, followed by the September 1 swing low of 183.53. Conversely, if the pair breaks above the Tenkan-Sen at 184.76 and climbs above the Kumo, that could expose the daily pivot at 185.15.
Technical Levels: Supports and Resistances
GBPJPY currently trading at 184.5 at the time of writing. Pair opened at 185.6 and is trading with a change of -0.59 % .
| Overview | Overview.1 | |
|---|---|---|
| 0 | Today last price | 184.50 |
| 1 | Today Daily Change | -1.10 |
| 2 | Today Daily Change % | -0.59 |
| 3 | Today daily open | 185.60 |
The pair is trading below its 20 Daily moving average @ 184.8, above its 50 Daily moving average @ 183.06 , above its 100 Daily moving average @ 178.16 and above its 200 Daily moving average @ 170.17
| Trends | Trends.1 | |
|---|---|---|
| 0 | Daily SMA20 | 184.80 |
| 1 | Daily SMA50 | 183.06 |
| 2 | Daily SMA100 | 178.16 |
| 3 | Daily SMA200 | 170.17 |
The previous day high was 185.78 while the previous day low was 184.08. The daily 38.2% Fib levels comes at 185.13, expected to provide resistance. Similarly, the daily 61.8% fib level is at 184.73, expected to provide resistance.
Note the levels of interest below:
- Pivot support is noted at 184.52, 183.44, 182.81
- Pivot resistance is noted at 186.23, 186.86, 187.94
| Levels | Levels.1 |
|---|---|
| Previous Daily High | 185.78 |
| Previous Daily Low | 184.08 |
| Previous Weekly High | 186.07 |
| Previous Weekly Low | 183.54 |
| Previous Monthly High | 186.77 |
| Previous Monthly Low | 180.46 |
| Daily Fibonacci 38.2% | 185.13 |
| Daily Fibonacci 61.8% | 184.73 |
| Daily Pivot Point S1 | 184.52 |
| Daily Pivot Point S2 | 183.44 |
| Daily Pivot Point S3 | 182.81 |
| Daily Pivot Point R1 | 186.23 |
| Daily Pivot Point R2 | 186.86 |
| Daily Pivot Point R3 | 187.94 |
[/s2If]
Download Nehcap EAWe have two EAs that are operational on our LIVE accounts.
- EA-FIX: Check out the details here. Download EA-FIX . EA-FIX is a non-grid HFT scalper.
- EA-GROWTH: High quality low dd EA using trend grids. Download EA_GROWTHJoin Our Telegram Group
")


