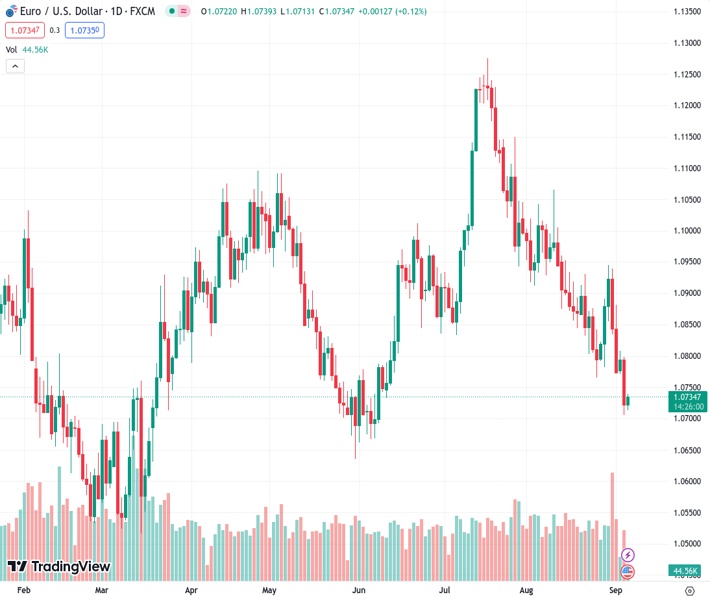
The EURUSD pair, currently trading at 1.07351, is facing difficulties in continuing its rebound from a three-month low following disappointing economic data from Germany.
…
This is a premium post.
[s2If !current_user_can(access_s2member_level4)]Please register for FREE REGISTER to read full post below containing analysis. In case of any error or you think you are not able to read the full post below, please email us at support#nehcap.com [lwa][/s2If] [s2If current_user_can(access_s2member_level1)]
- EUR/USD struggles to extend corrective bounce off three-month low after downbeat German data.
The pair currently trades last at 1.07351.
The previous day high was 1.0798 while the previous day low was 1.0706. The daily 38.2% Fib levels comes at 1.0742, expected to provide resistance. Similarly, the daily 61.8% fib level is at 1.0763, expected to provide resistance.
EUR/USD retreats from intraday high to 1.0730 while fading the corrective bounce off the lowest level in three months after downbeat German data publishing early Wednesday. In doing so, the Euro pair struggles to cheer the US Dollar’s pullback amid recession woes surrounding the Old Continent versus the hopes of witnessing a soft landing for the US. Even so, cautious mood ahead of the Eurozone Retail Sales for July and the US ISM Services PMI for August prods the pair sellers of late.
German Factory Orders slump the most since April 2020 with a -11.7% YoY figures compared to -4.0% expected and upwardly revised prior numbers of 7.6%. That said, the monthly statistics also declined heavily with -10.5% mark versus 3.3% prior (revised from 3.0%).
On the same line could be the downbeat prints of the previous day’s Eurozone Producer Price Index (PPI) for July and the economic fears cited in the European Central Bank’s (ECB) monthly survey of consumer expectations for inflation.
It should be noted that the upbeat details of the US Factory Orders and comments from the Federal Reserve (Fed) officials defend the US Dollar bulls even as a retreat in the yields allows the Greenback buyers to take a breather. On Tuesday, the US Factory Orders for July dropped to the lowest since mid-2020 while posting -2.1% MoM figures versus -0.1% expectations and 2.3% previous growth. However, the orders excluding transport rose 0.8% MoM, Shipments of goods stayed firmer and inventories marked the first increase in three months. That said, Federal Reserve (Fed) Governor Christopher Waller’s defense of hawkish monetary policy during a CNBC interview and Cleveland Federal Reserve President Loretta Mester’s rejection of rate cuts favor the US Dollar bulls.
Elsewhere, concerns about more stimulus for China’s real estate sector, per the Chinese media, seem to have fueled the property shares, especially backed by Country Garden’s avoidance of default. The same appears the key catalyst challenging the market’s previous risk-off mood and puts a floor under the EUR/USD price.
Against this backdrop, stock futures in the US and Europe print mild losses while tracing the Wall Street benchmarks whereas the US Dollar Index (DXY) seesaws at the highest level since March 15, dicey near 104.80 at the latest.
Moving on, more details of the US soft landing and the Eurozone recession will be eyed for clear directions.
A daily closing below the ascending support line stretched from March, now immediate resistance near 1.0790, directs the EUR/USD bears toward June’s low of 1.0635.
Technical Levels: Supports and Resistances
EURUSD currently trading at 1.0732 at the time of writing. Pair opened at 1.0722 and is trading with a change of 0.09% % .
| Overview | Overview.1 | |
|---|---|---|
| 0 | Today last price | 1.0732 |
| 1 | Today Daily Change | 0.0010 |
| 2 | Today Daily Change % | 0.09% |
| 3 | Today daily open | 1.0722 |
The pair remains strongly bearish on the daily time frame. It trades below the 20 SMA @ 1.0865, 50 SMA 1.0961, 100 SMA @ 1.0918 and 200 SMA @ 1.082.
| Trends | Trends.1 | |
|---|---|---|
| 0 | Daily SMA20 | 1.0865 |
| 1 | Daily SMA50 | 1.0961 |
| 2 | Daily SMA100 | 1.0918 |
| 3 | Daily SMA200 | 1.0820 |
The previous day high was 1.0798 while the previous day low was 1.0706. The daily 38.2% Fib levels comes at 1.0742, expected to provide resistance. Similarly, the daily 61.8% fib level is at 1.0763, expected to provide resistance.
Note the levels of interest below:
- Pivot support is noted at 1.0686, 1.065, 1.0594
- Pivot resistance is noted at 1.0778, 1.0834, 1.087
| Levels | Levels.1 |
|---|---|
| Previous Daily High | 1.0798 |
| Previous Daily Low | 1.0706 |
| Previous Weekly High | 1.0946 |
| Previous Weekly Low | 1.0772 |
| Previous Monthly High | 1.1065 |
| Previous Monthly Low | 1.0766 |
| Daily Fibonacci 38.2% | 1.0742 |
| Daily Fibonacci 61.8% | 1.0763 |
| Daily Pivot Point S1 | 1.0686 |
| Daily Pivot Point S2 | 1.0650 |
| Daily Pivot Point S3 | 1.0594 |
| Daily Pivot Point R1 | 1.0778 |
| Daily Pivot Point R2 | 1.0834 |
| Daily Pivot Point R3 | 1.0870 |
[/s2If]
Download Nehcap EAWe have two EAs that are operational on our LIVE accounts.
- EA-FIX: Check out the details here. Download EA-FIX . EA-FIX is a non-grid HFT scalper.
- EA-GROWTH: High quality low dd EA using trend grids. Download EA_GROWTHJoin Our Telegram Group
")


