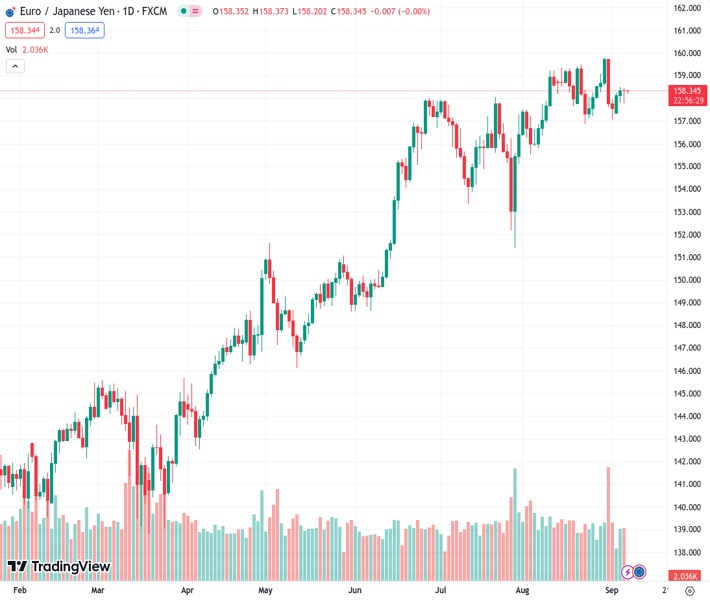
The EURJPY pair is holding steady around 158.31 at the start of Thursday’s Asian trading session after trading near 158.350.
…
This is a premium post.
[s2If !current_user_can(access_s2member_level4)]Please register for FREE REGISTER to read full post below containing analysis. In case of any error or you think you are not able to read the full post below, please email us at support#nehcap.com [lwa][/s2If] [s2If current_user_can(access_s2member_level1)]
- EUR/JPY trades almost flat at 158.31 as Thursday’s Asian session begins.
The pair currently trades last at 158.350.
The previous day high was 158.5 while the previous day low was 157.8. The daily 38.2% Fib levels comes at 158.24, expected to provide support. Similarly, the daily 61.8% fib level is at 158.07, expected to provide support.
The Euro (EUR) registers modest losses versus the Japanese Yen (JPY) as Thursday’s Asian session begins. On Wednesday, the pair finished unchanged, on a risk-off impulse and rumors of a possible intervention by Japanese authorities. The EUR/JPY is trading at 158.31, almost flat.
The EUR/JPY daily chart depicts the pair as neutral-biased but tilted to the downside as the cross remains trading near last week’s low of 157.05. It should be said that the Kijun-Sen caps the EUR/JPY fall at 157.65, which would open the door to test the August 23 swing low of 156.87 once cleared. A breach of the latter would resume the cross-currency pair downtrend and test the top of the Ichimoku Cloud (Kumo) at 154.70.
Short-term, the EUR/JPY is bullish biased with the cross exchanging hands above the Kumo, but so far, it has failed to register higher highs, suggesting the pair is consolidating. A break above 158.50 could exacerbate a rally towards the R1 daily pivot at 158.62, followed by the 159.00 figure. Conversely, downside risks emerge at the Tenkan and Kijun-Sen lines at 158.21 and 158.11 each. Once those levels are cleared, the 158.00 figure is up next.
Technical Levels: Supports and Resistances
EURJPY currently trading at 158.29 at the time of writing. Pair opened at 158.4 and is trading with a change of -0.07 % .
| Overview | Overview.1 | |
|---|---|---|
| 0 | Today last price | 158.29 |
| 1 | Today Daily Change | -0.11 |
| 2 | Today Daily Change % | -0.07 |
| 3 | Today daily open | 158.40 |
The pair is trading below its 20 Daily moving average @ 158.41, above its 50 Daily moving average @ 157.11 , above its 100 Daily moving average @ 153.69 and above its 200 Daily moving average @ 148.16
| Trends | Trends.1 | |
|---|---|---|
| 0 | Daily SMA20 | 158.41 |
| 1 | Daily SMA50 | 157.11 |
| 2 | Daily SMA100 | 153.69 |
| 3 | Daily SMA200 | 148.16 |
The previous day high was 158.5 while the previous day low was 157.8. The daily 38.2% Fib levels comes at 158.24, expected to provide support. Similarly, the daily 61.8% fib level is at 158.07, expected to provide support.
Note the levels of interest below:
- Pivot support is noted at 157.97, 157.54, 157.27
- Pivot resistance is noted at 158.66, 158.93, 159.36
| Levels | Levels.1 |
|---|---|
| Previous Daily High | 158.50 |
| Previous Daily Low | 157.80 |
| Previous Weekly High | 159.76 |
| Previous Weekly Low | 157.06 |
| Previous Monthly High | 159.76 |
| Previous Monthly Low | 155.53 |
| Daily Fibonacci 38.2% | 158.24 |
| Daily Fibonacci 61.8% | 158.07 |
| Daily Pivot Point S1 | 157.97 |
| Daily Pivot Point S2 | 157.54 |
| Daily Pivot Point S3 | 157.27 |
| Daily Pivot Point R1 | 158.66 |
| Daily Pivot Point R2 | 158.93 |
| Daily Pivot Point R3 | 159.36 |
[/s2If]
Download Nehcap EAWe have two EAs that are operational on our LIVE accounts.
- EA-FIX: Check out the details here. Download EA-FIX . EA-FIX is a non-grid HFT scalper.
- EA-GROWTH: High quality low dd EA using trend grids. Download EA_GROWTHJoin Our Telegram Group
")


