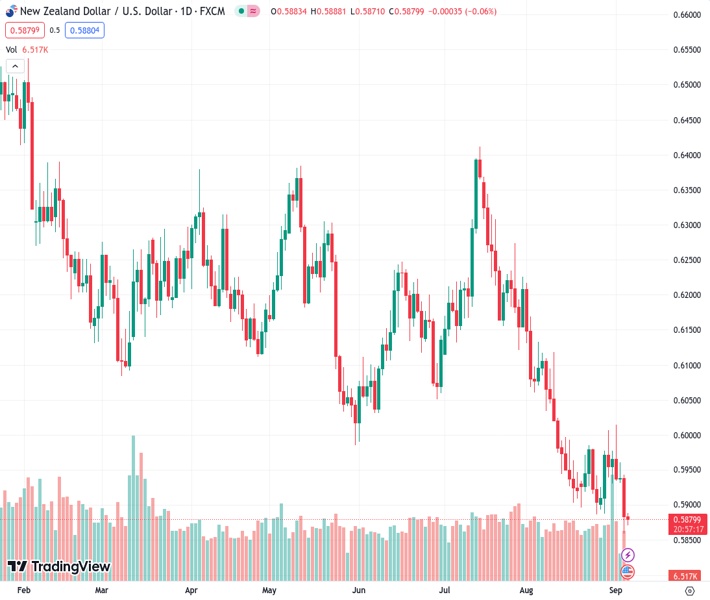
The currency pair NZDUSD, trading at a rate of 0.58833, is experiencing some selling pressure around 0.5885 due to a stronger US dollar.
…
This is a premium post.
[s2If !current_user_can(access_s2member_level4)]Please register for FREE REGISTER to read full post below containing analysis. In case of any error or you think you are not able to read the full post below, please email us at support#nehcap.com [lwa][/s2If] [s2If current_user_can(access_s2member_level1)]
- NZD/USD attracts some sellers near 0.5885 amid a stronger USD.
The pair currently trades last at 0.58833.
The previous day high was 0.5961 while the previous day low was 0.5931. The daily 38.2% Fib levels comes at 0.5943, expected to provide resistance. Similarly, the daily 61.8% fib level is at 0.595, expected to provide resistance.
The NZD/USD pair remains on the defensive below the 0.5900 mark during the early Asian trading hours on Wednesday. The pair currently trades around 0.5885, gaining 0.04% on the day. The downbeat Chinese economic data weigh on the market sentiment, which lifts the US Dollar Index (DXY) to a nearly nine-month high.
The US Department of Commerce reported on Tuesday that US Factory Orders for July marked the lowest since mid-2020. The figure came in at -2.1% MoM from 2.3% in the previous month and below the market consensus of -0.1%. The highly anticipated data last week showed that the US Nonfarm Payrolls (NFP) for August came in at 187K, beating the expectations of 170K and 157K in the previous reading. While, The Unemployment Rate dropped significantly to 3.8%, compared to the market consensus of 3.5% and 3.5% prior.
According to the CME FedWatch Tool, the possibility of an interest rate hold at the September meeting remains at 93%, which might cap the upside in the USD. However, the hawkish remark by officials lifted the greenback broadly. That said, Federal Reserve (Fed) Governor Christopher Waller said the Fed has more room to raise more interest rates. He added that the data will determine if the Fed needs to raise rates again and whether the Fed is done raising rates.
On the Kiwi front, the ANZ Commodity Price for August dropped to 2.9% from a 2.6% decline in July. Earlier this week, the New Zealand Terms of Trade Index improved to 0.4% in the second quarter, compared to a decline of 1.5% in the previous reading and an expected drop of 1.3%.
Furthermore, the weaker-than-expected Chinese Services PMI data weigh on the risk sentiment and exert pressure on the China-proxy New Zealand Dollar (NZD). China’s services activity in August grew at the slowest pace in eight months. Caixin reported on Tuesday that the Chinese Services Purchasing Managers’ Index (PMI) fell to 51.8 in August from 54.1 in July.
Moving on, market players will closely watch the US ISM Servies PMI for August due later on Wednesday. The figure is expected to ease to 52.6 in August from 52.7 in the previous month. Traders will take cues from the data and find trading opportunities around the NZD/USD pair.
Technical Levels: Supports and Resistances
NZDUSD currently trading at 0.5883 at the time of writing. Pair opened at 0.594 and is trading with a change of -0.96 % .
| Overview | Overview.1 | |
|---|---|---|
| 0 | Today last price | 0.5883 |
| 1 | Today Daily Change | -0.0057 |
| 2 | Today Daily Change % | -0.9600 |
| 3 | Today daily open | 0.5940 |
The pair remains strongly bearish on the daily time frame. It trades below the 20 SMA @ 0.596, 50 SMA 0.6098, 100 SMA @ 0.6135 and 200 SMA @ 0.6219.
| Trends | Trends.1 | |
|---|---|---|
| 0 | Daily SMA20 | 0.5960 |
| 1 | Daily SMA50 | 0.6098 |
| 2 | Daily SMA100 | 0.6135 |
| 3 | Daily SMA200 | 0.6219 |
The previous day high was 0.5961 while the previous day low was 0.5931. The daily 38.2% Fib levels comes at 0.5943, expected to provide resistance. Similarly, the daily 61.8% fib level is at 0.595, expected to provide resistance.
Note the levels of interest below:
- Pivot support is noted at 0.5927, 0.5914, 0.5897
- Pivot resistance is noted at 0.5957, 0.5974, 0.5987
| Levels | Levels.1 |
|---|---|
| Previous Daily High | 0.5961 |
| Previous Daily Low | 0.5931 |
| Previous Weekly High | 0.6015 |
| Previous Weekly Low | 0.5887 |
| Previous Monthly High | 0.6219 |
| Previous Monthly Low | 0.5885 |
| Daily Fibonacci 38.2% | 0.5943 |
| Daily Fibonacci 61.8% | 0.5950 |
| Daily Pivot Point S1 | 0.5927 |
| Daily Pivot Point S2 | 0.5914 |
| Daily Pivot Point S3 | 0.5897 |
| Daily Pivot Point R1 | 0.5957 |
| Daily Pivot Point R2 | 0.5974 |
| Daily Pivot Point R3 | 0.5987 |
[/s2If]
Download Nehcap EAWe have two EAs that are operational on our LIVE accounts.
- EA-FIX: Check out the details here. Download EA-FIX . EA-FIX is a non-grid HFT scalper.
- EA-GROWTH: High quality low dd EA using trend grids. Download EA_GROWTHJoin Our Telegram Group
")


