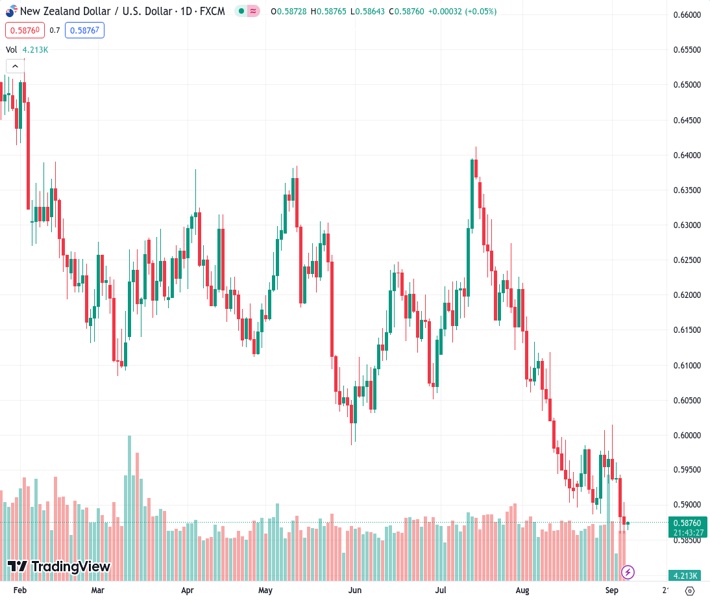
The currency pair NZDUSD is still in a defensive position, trading below the 0.5900 level due to the USD gaining strength.
…
This is a premium post.
[s2If !current_user_can(access_s2member_level4)]Please register for FREE REGISTER to read full post below containing analysis. In case of any error or you think you are not able to read the full post below, please email us at support#nehcap.com [lwa][/s2If] [s2If current_user_can(access_s2member_level1)]
- NZD/USD remains on the defensive below the 0.5900 barrier amid a stronger USD.
The pair currently trades last at 0.58761.
The previous day high was 0.595 while the previous day low was 0.5859. The daily 38.2% Fib levels comes at 0.5894, expected to provide resistance. Similarly, the daily 61.8% fib level is at 0.5916, expected to provide resistance.
The NZD/USD pair remains under pressure and reaches the lowest level since November 2022 during the early Asian session on Thursday. The pair currently trades near 0.5872, down 0.01% on the day.
The Institute for Supply Management (ISM) revealed on Wednesday that the US ISM Services PMI climbed to 54.5 in August from 52.7 in the previous month, better than the market expectation of 52.5. This figure marks the highest reading since February. Additionally, the final readings of the S&P Global Composite dropped to 50.2 in August from 50.4 in the previous month.
The Federal Reserve (Fed) Governor Christopher Waller stated that they have further room to increase interest rates, but the data will determine whether the Fed needs to hike rates again and if it is done hiking rates.
On the Kiwi front, the latest data from Statistics New Zealand showed on Thursday that the nation’s Manufacturing Sales for the second quarter improved to 2.9% versus a 2.1% drop in the previous reading. Earlier this week, the ANZ Commodity Price for August dropped to 2.9% from a 2.6% decline in July. The New Zealand Terms of Trade Index improved to 0.4% in the second quarter, compared to a decline of 1.5% in the previous reading and an expected drop of 1.3%.
Apart from this, the disappointing Chinese economic data impact market sentiment and exert pressure on the China-proxy New Zealand Dollar (NZD). Even so, China’s services activity expanded at its weakest rate in eight months in August. Tuesday, Caixin reported that the Chinese Services Purchasing Managers’ Index (PMI) decreased from 54.1 in July to 51.8 in August.
Looking ahead, China’s Trade Balance will be released later in the Asian session. Also, the US weekly Initial Jobless Claims and Unit Labor Costs for the second quarter will be due on Thursday. These figures could give a clear direction for NZD/USD.
Technical Levels: Supports and Resistances
NZDUSD currently trading at 0.5873 at the time of writing. Pair opened at 0.5883 and is trading with a change of -0.17 % .
| Overview | Overview.1 | |
|---|---|---|
| 0 | Today last price | 0.5873 |
| 1 | Today Daily Change | -0.0010 |
| 2 | Today Daily Change % | -0.1700 |
| 3 | Today daily open | 0.5883 |
The pair remains strongly bearish on the daily time frame. It trades below the 20 SMA @ 0.5951, 50 SMA 0.6093, 100 SMA @ 0.6132 and 200 SMA @ 0.6218.
| Trends | Trends.1 | |
|---|---|---|
| 0 | Daily SMA20 | 0.5951 |
| 1 | Daily SMA50 | 0.6093 |
| 2 | Daily SMA100 | 0.6132 |
| 3 | Daily SMA200 | 0.6218 |
The previous day high was 0.595 while the previous day low was 0.5859. The daily 38.2% Fib levels comes at 0.5894, expected to provide resistance. Similarly, the daily 61.8% fib level is at 0.5916, expected to provide resistance.
Note the levels of interest below:
- Pivot support is noted at 0.5844, 0.5806, 0.5753
- Pivot resistance is noted at 0.5936, 0.5989, 0.6028
| Levels | Levels.1 |
|---|---|
| Previous Daily High | 0.5950 |
| Previous Daily Low | 0.5859 |
| Previous Weekly High | 0.6015 |
| Previous Weekly Low | 0.5887 |
| Previous Monthly High | 0.6219 |
| Previous Monthly Low | 0.5885 |
| Daily Fibonacci 38.2% | 0.5894 |
| Daily Fibonacci 61.8% | 0.5916 |
| Daily Pivot Point S1 | 0.5844 |
| Daily Pivot Point S2 | 0.5806 |
| Daily Pivot Point S3 | 0.5753 |
| Daily Pivot Point R1 | 0.5936 |
| Daily Pivot Point R2 | 0.5989 |
| Daily Pivot Point R3 | 0.6028 |
[/s2If]
Download Nehcap EAWe have two EAs that are operational on our LIVE accounts.
- EA-FIX: Check out the details here. Download EA-FIX . EA-FIX is a non-grid HFT scalper.
- EA-GROWTH: High quality low dd EA using trend grids. Download EA_GROWTHJoin Our Telegram Group
")


