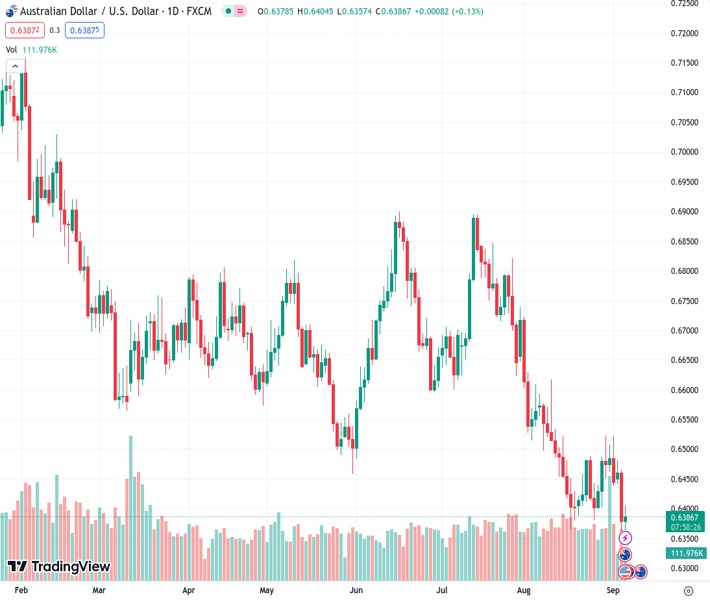
The #AUDUSD pair, currently trading at 0.63871, is encountering downward pressure around the 0.6400 level due to the US Dollar’s ongoing strength.
…
This is a premium post.
[s2If !current_user_can(access_s2member_level4)]Please register for FREE REGISTER to read full post below containing analysis. In case of any error or you think you are not able to read the full post below, please email us at support#nehcap.com [lwa][/s2If] [s2If current_user_can(access_s2member_level1)]
- AUD/USD faces selling pressure near 0.6400 as the US Dollar remains resilient.
The pair currently trades last at 0.63871.
The previous day high was 0.6465 while the previous day low was 0.6358. The daily 38.2% Fib levels comes at 0.6399, expected to provide resistance. Similarly, the daily 61.8% fib level is at 0.6424, expected to provide resistance.
The AUD/USD pair faces selling interest near the round-level resistance of 0.6400 in the late European session. The upside in the Aussie asset remains restricted due to the resilient US Dollar and China’s vulnerable economic outlook.
The Australian Dollar witnessed some buying early Wednesday due to upbeat Gross Domestic Product (GDP) data for the April-June quarter. The economy grew at a steady pace of 0.4%, a higher-than-expected growth rate of 0.3%. On an annualized basis, Q2 GDP dropped to 2.1% from the Q1 growth rate of 2.4% but remained higher than expectations of 1.7%.
Meanwhile, investors await US ISM Services PMI for August, which will be published at 14:00 GMT. Analysts at TD Securities expect the US ISM Services PMI to hold steady at 52.7 in August.
AUD/USD tests the breakdown of the sideways channel near the round-level resistance of 0.6400 on a two-hour scale. The asset remains vulnerable as the 20-period Exponential Moving Average (EMA) near 0.6400 continues to act as a barrier for the Australian Dollar bulls.
The Relative Strength Index (RSI) (14) rebounds into the 40.00-60.00 range while the downside bias remains firmer.
A fresh downside would appear if the Aussie asset dropped below August 17 low around 0.6360. This would expose the asset to the round-level support of 0.6300 followed by 03 November 2022 low at 0.6272.
On the contrary, a recovery move above August 15 high around 0.6522 will drive the asset to August 9 high at 0.6571. Breach of the latter will drive the asset towards August 10 high at 0.6616.
Technical Levels: Supports and Resistances
AUDUSD currently trading at 0.6387 at the time of writing. Pair opened at 0.6379 and is trading with a change of 0.13 % .
| Overview | Overview.1 | |
|---|---|---|
| 0 | Today last price | 0.6387 |
| 1 | Today Daily Change | 0.0008 |
| 2 | Today Daily Change % | 0.1300 |
| 3 | Today daily open | 0.6379 |
The pair remains strongly bearish on the daily time frame. It trades below the 20 SMA @ 0.6451, 50 SMA 0.6596, 100 SMA @ 0.6637 and 200 SMA @ 0.6719.
| Trends | Trends.1 | |
|---|---|---|
| 0 | Daily SMA20 | 0.6451 |
| 1 | Daily SMA50 | 0.6596 |
| 2 | Daily SMA100 | 0.6637 |
| 3 | Daily SMA200 | 0.6719 |
The previous day high was 0.6465 while the previous day low was 0.6358. The daily 38.2% Fib levels comes at 0.6399, expected to provide resistance. Similarly, the daily 61.8% fib level is at 0.6424, expected to provide resistance.
Note the levels of interest below:
- Pivot support is noted at 0.6336, 0.6293, 0.6229
- Pivot resistance is noted at 0.6443, 0.6507, 0.655
| Levels | Levels.1 |
|---|---|
| Previous Daily High | 0.6465 |
| Previous Daily Low | 0.6358 |
| Previous Weekly High | 0.6522 |
| Previous Weekly Low | 0.6401 |
| Previous Monthly High | 0.6724 |
| Previous Monthly Low | 0.6364 |
| Daily Fibonacci 38.2% | 0.6399 |
| Daily Fibonacci 61.8% | 0.6424 |
| Daily Pivot Point S1 | 0.6336 |
| Daily Pivot Point S2 | 0.6293 |
| Daily Pivot Point S3 | 0.6229 |
| Daily Pivot Point R1 | 0.6443 |
| Daily Pivot Point R2 | 0.6507 |
| Daily Pivot Point R3 | 0.6550 |
[/s2If]
Download Nehcap EAWe have two EAs that are operational on our LIVE accounts.
- EA-FIX: Check out the details here. Download EA-FIX . EA-FIX is a non-grid HFT scalper.
- EA-GROWTH: High quality low dd EA using trend grids. Download EA_GROWTHJoin Our Telegram Group
")


