Silver prices have slightly increased but remain at a low point for the past two weeks after experiencing the biggest drop in a month. Analysts predict that there is potential for further decline.
…
This is a premium post.
[s2If !current_user_can(access_s2member_level4)]Please register for FREE REGISTER to read full post below containing analysis. In case of any error or you think you are not able to read the full post below, please email us at support#nehcap.com [lwa][/s2If] [s2If current_user_can(access_s2member_level1)]
- Silver Price prints mild gains at two-week low after falling the most in a month.
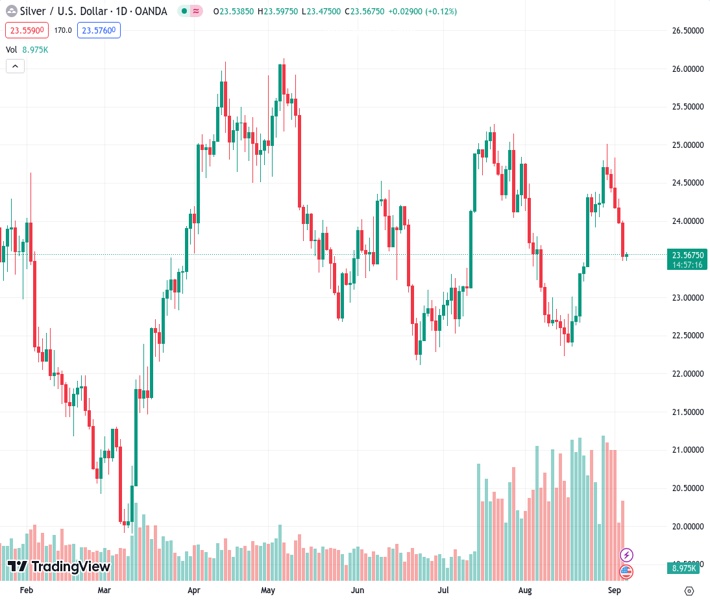
The pair currently trades last at 23.572.
The previous day high was 24.0 while the previous day low was 23.48. The daily 38.2% Fib levels comes at 23.68, expected to provide resistance. Similarly, the daily 61.8% fib level is at 23.8, expected to provide resistance.
Silver Price (XAG/USD) licks its wounds while posting mild gains near $23.55 heading into Wednesday’s European session. In doing so, the bright metal bounces off the lowest level in two weeks, marked the previous day, as it consolidates the biggest daily loss in a month.
That said, the oversold RSI conditions seem to help the risk takers while the XAG/USD prints the first daily gain in six, so far.
However, the bearish MACD signals and an impending Bull Cross between the 100-SMA and the 200-SMA, a bullish signal for the asset’s price when the short-term SMA pierces the longer-term ones from below, test the Silver bears of late.
In a case where the Silver buyers manage to confirm the bull cross by surpassing the SMA confluence surrounding $23.75, a quick run-up towards the 61.8% Fibonacci retracement of July–August downside, near $24.15, and then to the 50-SMA level of $24.25 can’t be denied.
Even so, a downward-sloping resistance line from July 20, close to $24.65 at the latest, appears a tough nut to crack for the Silver buyers past $24.25.
On the contrary, the 38.2% and 23.6% Fibonacci ratios, respectively near $23.40 and $22.95, will challenge the Silver bears before directing them to the previous monthly low of around $22.25.
Trend: Further Downside expected
Technical Levels: Supports and Resistances
XAGUSD currently trading at 23.56 at the time of writing. Pair opened at 23.54 and is trading with a change of 0.08% % .
| Overview | Overview.1 | |
|---|---|---|
| 0 | Today last price | 23.56 |
| 1 | Today Daily Change | 0.02 |
| 2 | Today Daily Change % | 0.08% |
| 3 | Today daily open | 23.54 |
The pair is trading above its 20 Daily moving average @ 23.51, below its 50 Daily moving average @ 23.72 , below its 100 Daily moving average @ 23.91 and above its 200 Daily moving average @ 23.46
| Trends | Trends.1 | |
|---|---|---|
| 0 | Daily SMA20 | 23.51 |
| 1 | Daily SMA50 | 23.72 |
| 2 | Daily SMA100 | 23.91 |
| 3 | Daily SMA200 | 23.46 |
The previous day high was 24.0 while the previous day low was 23.48. The daily 38.2% Fib levels comes at 23.68, expected to provide resistance. Similarly, the daily 61.8% fib level is at 23.8, expected to provide resistance.
Note the levels of interest below:
- Pivot support is noted at 23.34, 23.14, 22.81
- Pivot resistance is noted at 23.87, 24.2, 24.4
| Levels | Levels.1 |
|---|---|
| Previous Daily High | 24.00 |
| Previous Daily Low | 23.48 |
| Previous Weekly High | 25.02 |
| Previous Weekly Low | 24.05 |
| Previous Monthly High | 25.02 |
| Previous Monthly Low | 22.23 |
| Daily Fibonacci 38.2% | 23.68 |
| Daily Fibonacci 61.8% | 23.80 |
| Daily Pivot Point S1 | 23.34 |
| Daily Pivot Point S2 | 23.14 |
| Daily Pivot Point S3 | 22.81 |
| Daily Pivot Point R1 | 23.87 |
| Daily Pivot Point R2 | 24.20 |
| Daily Pivot Point R3 | 24.40 |
[/s2If]
Download Nehcap EAWe have two EAs that are operational on our LIVE accounts.
- EA-FIX: Check out the details here. Download EA-FIX . EA-FIX is a non-grid HFT scalper.
- EA-GROWTH: High quality low dd EA using trend grids. Download EA_GROWTHJoin Our Telegram Group
")


