Sellers are showing interest in EURUSD around 1.0735 due to concerns about a potential economic downturn.
…
This is a premium post.
[s2If !current_user_can(access_s2member_level4)]Please register for FREE REGISTER to read full post below containing analysis. In case of any error or you think you are not able to read the full post below, please email us at support#nehcap.com [lwa][/s2If] [s2If current_user_can(access_s2member_level1)]
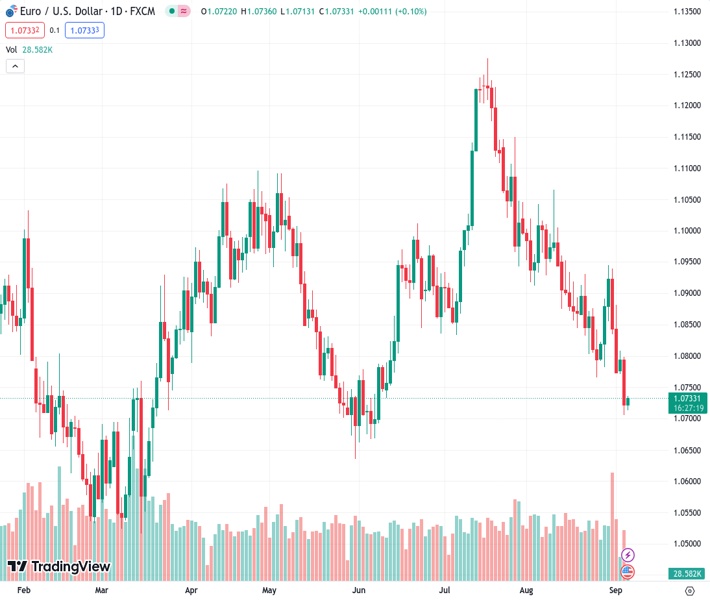
- EURUSD attracts some sellers near 1.0735 amid fears of a potential recession.
The pair currently trades last at 1.07325.
The previous day high was 1.0798 while the previous day low was 1.0706. The daily 38.2% Fib levels comes at 1.0742, expected to provide resistance. Similarly, the daily 61.8% fib level is at 1.0763, expected to provide resistance.
The EUR/USD pair remains under selling pressure near 1.0732 during the early Asian session on Wednesday. The Euro is weakened against the US Dollar (USD) amid fears of a recession in the Eurozone following the weaker economic data.
Data released by the Eurostat revealed on Tuesday that producer prices in the Eurozone fell for the seventh straight month in July. The Eurozone Producer Price Index (PPI) for July dropped to -0.5% MoM from -0.4% prior while the annual figure fell -7.6% from the previous’s reading of -3.4%. Additionally, HCOB Composite PMI for August declined to 46.7 from 47.0 in July. Finally, the HCOB Services PMI for the same period dropped to 47.9 from 48.3 in July. In response to the downbeat data, the Euro extends its downside as investors worry about the potential recession. The discouraging data might convince the European Central Bank (ECB) to abandon its hawkish stance for the upcoming meeting.
Earlier this week, ECB President Christine Lagarde emphasized the importance of central banks keeping inflation expectations firmly anchored. The ECB Council Member Joachim Nagel advocated for price stability but refrained from providing further details while his colleague Pierre Wunsch said that the central bank could do a little bit more and it’s too early to talk about ending hikes entirely.
Across the pond, the US Factory Orders for July dropped to the lowest since mid-2020. The figure came in at -2.1% MoM, compared with a rise of 2.3% last month, and lower than the market’s forecast of 0.1%. About last week’s data, the US Nonfarm Payrolls (NFP) for August came in at 187K, above the previous readings of 157K and above the market consensus of 170K.
Market participants anticipate a 25 basis point (bps) rate hike for the entire year, bringing rates to 5.75%, according to the World Interest Rates Probabilities (WIRP) tool. Apart from this, Federal Reserve (Fed) Governor Christopher Waller said the Fed has more room to raise interest rates. He added that the data will determine if the Fed needs to raise rates again and whether the Fed is done raising rates. This hawkish remark boosts the US Dollar firmer against the EUR and acts as a headwind for the EUR/USD pair.
Market participants will monitor the German Factory Orders and Eurozone Retail Sales for July for fresh impetus later in the day. On the US docket, the US ISM Services PMI for August will be released on Wednesday. Traders will take cues from the statement and find trading opportunities around the EUR/USD pair.
Technical Levels: Supports and Resistances
EURUSD currently trading at 1.0734 at the time of writing. Pair opened at 1.0722 and is trading with a change of 0.11 % .
| Overview | Overview.1 | |
|---|---|---|
| 0 | Today last price | 1.0734 |
| 1 | Today Daily Change | 0.0012 |
| 2 | Today Daily Change % | 0.1100 |
| 3 | Today daily open | 1.0722 |
The pair remains strongly bearish on the daily time frame. It trades below the 20 SMA @ 1.0865, 50 SMA 1.0961, 100 SMA @ 1.0918 and 200 SMA @ 1.082.
| Trends | Trends.1 | |
|---|---|---|
| 0 | Daily SMA20 | 1.0865 |
| 1 | Daily SMA50 | 1.0961 |
| 2 | Daily SMA100 | 1.0918 |
| 3 | Daily SMA200 | 1.0820 |
The previous day high was 1.0798 while the previous day low was 1.0706. The daily 38.2% Fib levels comes at 1.0742, expected to provide resistance. Similarly, the daily 61.8% fib level is at 1.0763, expected to provide resistance.
Note the levels of interest below:
- Pivot support is noted at 1.0686, 1.065, 1.0594
- Pivot resistance is noted at 1.0778, 1.0834, 1.087
| Levels | Levels.1 |
|---|---|
| Previous Daily High | 1.0798 |
| Previous Daily Low | 1.0706 |
| Previous Weekly High | 1.0946 |
| Previous Weekly Low | 1.0772 |
| Previous Monthly High | 1.1065 |
| Previous Monthly Low | 1.0766 |
| Daily Fibonacci 38.2% | 1.0742 |
| Daily Fibonacci 61.8% | 1.0763 |
| Daily Pivot Point S1 | 1.0686 |
| Daily Pivot Point S2 | 1.0650 |
| Daily Pivot Point S3 | 1.0594 |
| Daily Pivot Point R1 | 1.0778 |
| Daily Pivot Point R2 | 1.0834 |
| Daily Pivot Point R3 | 1.0870 |
[/s2If]
Download Nehcap EAWe have two EAs that are operational on our LIVE accounts.
- EA-FIX: Check out the details here. Download EA-FIX . EA-FIX is a non-grid HFT scalper.
- EA-GROWTH: High quality low dd EA using trend grids. Download EA_GROWTHJoin Our Telegram Group
")


