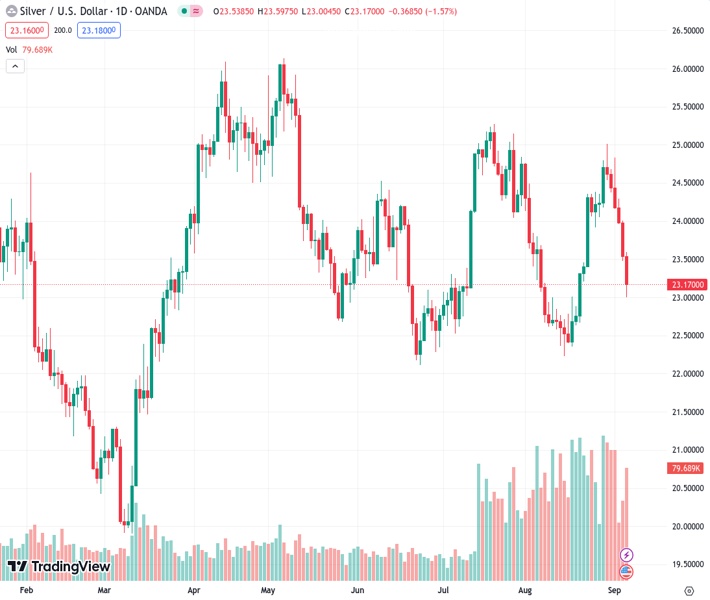
On Wednesday, the value of XAGUSD dropped by over 1.50%, reaching approximately $23.00.
…
This is a premium post.
[s2If !current_user_can(access_s2member_level4)]Please register for FREE REGISTER to read full post below containing analysis. In case of any error or you think you are not able to read the full post below, please email us at support#nehcap.com [lwa][/s2If] [s2If current_user_can(access_s2member_level1)]
- XAG/USD fell by more than 1.50% on Wednesday, near $23.00.
The pair currently trades last at 23.169.
The previous day high was 24.0 while the previous day low was 23.48. The daily 38.2% Fib levels comes at 23.68, expected to provide resistance. Similarly, the daily 61.8% fib level is at 23.8, expected to provide resistance.
On Wednesday, the XAG/USD Silver Spot price closed near $23.00, as the reports of strong US economic activity fueled expectations of a more aggressive Federal Reserve (Fed) for the remainder of the year.
US bond yields sharply rose, often seen as the opportunity cost of holding non-yielding metals. The rate for the 2-year bond increased to 5%, whereas the rates for the 5-year and 10-year yields are at 4.43% and 4.30%, respectively. In addition, the USD measured by the DXY index turned its course north after the release of August’s ISM PMI and increased above 105.00, presenting further challenges to the metal. In addition, the Fed’s Beige Book from July and August from the US reported slower economic growth while it pointed out that the job growth remained “subdued.”
In addition, Wall Street didn’t welcome the ISM figures, and the S&P 500 dropped by nearly 0.80% to its lowest level in a week. The Dow Jones Industrial Average (DJI) and the Nasdaq Composite (NDX) also decreased, with losses between 0.50-0.80%.
Analysing the daily chart, the XAG/USD technical outlook is bearish in the short term. The Relative Strength Index (RSI) is comfortably positioned below its midline in negative territory with a southward slope, indicating a favourable selling momentum, further supported by the negative signal from the Moving Average Convergence Divergence (MACD), which is displaying red bars, underscoring the growing bearish momentum. Additionally, the pair is below the 20-, 100- and 200-day Simple Moving Averages (SMA), pointing towards the prevailing strength of the bears in the larger context.
Furthermore, the four-hour chart flashes oversold signals, which could suggest that the metal may correct to the upside in the near term.
Support levels: $22.60, $22.30, $22.00
Resistance levels: $23.50 (20- and 200-day SMA convergence), $23.70, $24.00.
Technical Levels: Supports and Resistances
XAGUSD currently trading at 23.18 at the time of writing. Pair opened at 23.54 and is trading with a change of -1.53 % .
| Overview | Overview.1 | |
|---|---|---|
| 0 | Today last price | 23.18 |
| 1 | Today Daily Change | -0.36 |
| 2 | Today Daily Change % | -1.53 |
| 3 | Today daily open | 23.54 |
The pair remains strongly bearish on the daily time frame. It trades below the 20 SMA @ 23.51, 50 SMA 23.72, 100 SMA @ 23.91 and 200 SMA @ 23.46.
| Trends | Trends.1 | |
|---|---|---|
| 0 | Daily SMA20 | 23.51 |
| 1 | Daily SMA50 | 23.72 |
| 2 | Daily SMA100 | 23.91 |
| 3 | Daily SMA200 | 23.46 |
The previous day high was 24.0 while the previous day low was 23.48. The daily 38.2% Fib levels comes at 23.68, expected to provide resistance. Similarly, the daily 61.8% fib level is at 23.8, expected to provide resistance.
Note the levels of interest below:
- Pivot support is noted at 23.34, 23.14, 22.81
- Pivot resistance is noted at 23.87, 24.2, 24.4
| Levels | Levels.1 |
|---|---|
| Previous Daily High | 24.00 |
| Previous Daily Low | 23.48 |
| Previous Weekly High | 25.02 |
| Previous Weekly Low | 24.05 |
| Previous Monthly High | 25.02 |
| Previous Monthly Low | 22.23 |
| Daily Fibonacci 38.2% | 23.68 |
| Daily Fibonacci 61.8% | 23.80 |
| Daily Pivot Point S1 | 23.34 |
| Daily Pivot Point S2 | 23.14 |
| Daily Pivot Point S3 | 22.81 |
| Daily Pivot Point R1 | 23.87 |
| Daily Pivot Point R2 | 24.20 |
| Daily Pivot Point R3 | 24.40 |
[/s2If]
Download Nehcap EAWe have two EAs that are operational on our LIVE accounts.
- EA-FIX: Check out the details here. Download EA-FIX . EA-FIX is a non-grid HFT scalper.
- EA-GROWTH: High quality low dd EA using trend grids. Download EA_GROWTHJoin Our Telegram Group
")


