The US Dollar to Mexican Peso currency pair, with a value of 17.3572, increased by 0.88% and is now trading at 17.3270. This occurred as a result of the Bank of Mexico reducing its currency hedge program, which has led to increased instability in the currency pair.
…
This is a premium post.
[s2If !current_user_can(access_s2member_level4)]Please register for FREE REGISTER to read full post below containing analysis. In case of any error or you think you are not able to read the full post below, please email us at support#nehcap.com [lwa][/s2If] [s2If current_user_can(access_s2member_level1)]
- USD/MXN pair gained 0.88% to trade at 17.3270 after the Bank of Mexico slashed its currency hedge program, adding volatility to the currency pair.
The pair currently trades last at 17.3572.
The previous day high was 17.1948 while the previous day low was 17.0447. The daily 38.2% Fib levels comes at 17.1375, expected to provide support. Similarly, the daily 61.8% fib level is at 17.1021, expected to provide support.
The Mexican Peso (MXN) extended its slide for four straight days against the Greenback (USD) after the Bank of Mexico (Banxico) decided to slash its currency hedge program, designed to stabilize currency fluctuations that could trigger volatility in the USD/MXN pair. That, alongside risk aversion, hurts the emerging market currency, as the pair trades at 17.3270 and gains 0.88% at the time of writing.
Risk aversion due to the latest results of PMIs from China and the Eurozone (EU) worsened the global economic outlook. Hence, traders seeking safety flock towards the Greenback (USD), while US Treasury bond yields rose.
China revealed its Caixin Services PMI expanding at a lower rate than estimates of 53.6 at 51.8 and below the previous month’s reading of 54.1. In the meantime, data from the United States showed that Factory Orders decreased -2.1% less than market expectations of a -2.5% plunge after four consecutive months of increases, as the US Department of Commerce revealed.
In the meantime, Fed speakers crossing newswires boosted the US Dollar. Christopher Waller, a Fed Governors said the Fed has space to decide its next interest rate decision, while Cleveland’s Fed President Loretta Mester said the Fed would not continue to tighten monetary policy until inflation hits 2%, nor wait until it gets there, to lower rates.
Meanwhile, US Treasury bond yields are persistently on the rise, notably the 10-year Treasury bond yield, which has surged by six basis points to reach 4.261%. This upward movement is favorably impacting the USD/MXN pair. The US Dollar Index (DXY), which gauges the US Dollar’s performance against six major currencies, has shown significant gains of 0.61%, reaching 104.794. This marks its highest point since March 13, 2023.
In the upcoming events, the release of the US ISM Non-Manufacturing PMI for August is anticipated to show a minor slowdown from 52.7 to 52.5. Similarly, the S&P Global Services PMI is likely to exhibit a comparable trend, with estimates at 51, compared to July’s 52.3. If both readings align with expectations, this could exert pressure on the US Dollar. Such outcomes might reinforce the Federal Reserve’s pause in September and diminish the likelihood of an additional interest rate increase in November.
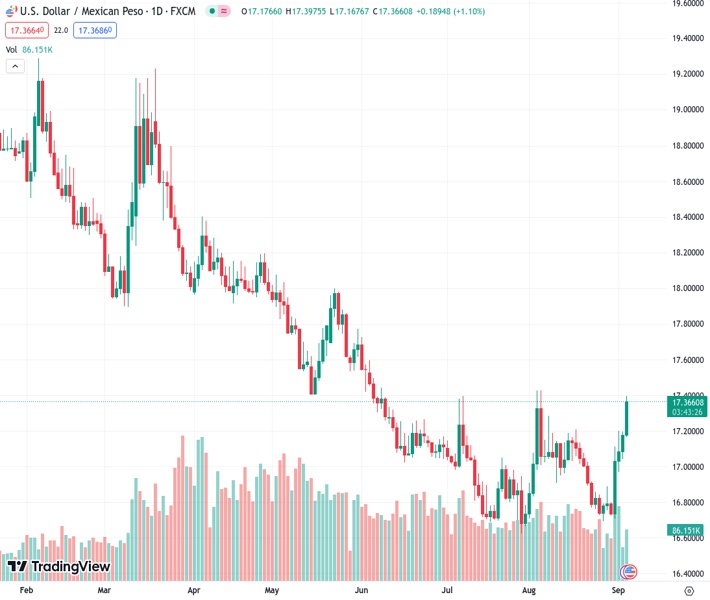
The daily chart portrays the pair as neutral biased, though the USD/MXN exchange rate sits above the 100-day Moving Average (DMA); a daily close above the latter could put into play a challenge of the crucial May 17 swing low-turned resistance at 17.4039. Once cleared, the pair could edge towards the 18.0000 figure. Downside risks would emerge if the pair drops below the 17.0000 mark.
Technical Levels: Supports and Resistances
USDMXN currently trading at 17.3404 at the time of writing. Pair opened at 17.1772 and is trading with a change of 0.95 % .
| Overview | Overview.1 | |
|---|---|---|
| 0 | Today last price | 17.3404 |
| 1 | Today Daily Change | 0.1632 |
| 2 | Today Daily Change % | 0.9500 |
| 3 | Today daily open | 17.1772 |
The pair is trading above its 20 Daily moving average @ 16.9872, above its 50 Daily moving average @ 16.9729 , above its 100 Daily moving average @ 17.2964 and below its 200 Daily moving average @ 18.0541
| Trends | Trends.1 | |
|---|---|---|
| 0 | Daily SMA20 | 16.9872 |
| 1 | Daily SMA50 | 16.9729 |
| 2 | Daily SMA100 | 17.2964 |
| 3 | Daily SMA200 | 18.0541 |
The previous day high was 17.1948 while the previous day low was 17.0447. The daily 38.2% Fib levels comes at 17.1375, expected to provide support. Similarly, the daily 61.8% fib level is at 17.1021, expected to provide support.
Note the levels of interest below:
- Pivot support is noted at 17.0831, 16.9889, 16.933
- Pivot resistance is noted at 17.2331, 17.289, 17.3832
| Levels | Levels.1 |
|---|---|
| Previous Daily High | 17.1948 |
| Previous Daily Low | 17.0447 |
| Previous Weekly High | 17.2025 |
| Previous Weekly Low | 16.6945 |
| Previous Monthly High | 17.4274 |
| Previous Monthly Low | 16.6945 |
| Daily Fibonacci 38.2% | 17.1375 |
| Daily Fibonacci 61.8% | 17.1021 |
| Daily Pivot Point S1 | 17.0831 |
| Daily Pivot Point S2 | 16.9889 |
| Daily Pivot Point S3 | 16.9330 |
| Daily Pivot Point R1 | 17.2331 |
| Daily Pivot Point R2 | 17.2890 |
| Daily Pivot Point R3 | 17.3832 |
[/s2If]
Download Nehcap EAWe have two EAs that are operational on our LIVE accounts.
- EA-FIX: Check out the details here. Download EA-FIX . EA-FIX is a non-grid HFT scalper.
- EA-GROWTH: High quality low dd EA using trend grids. Download EA_GROWTHJoin Our Telegram Group
")


