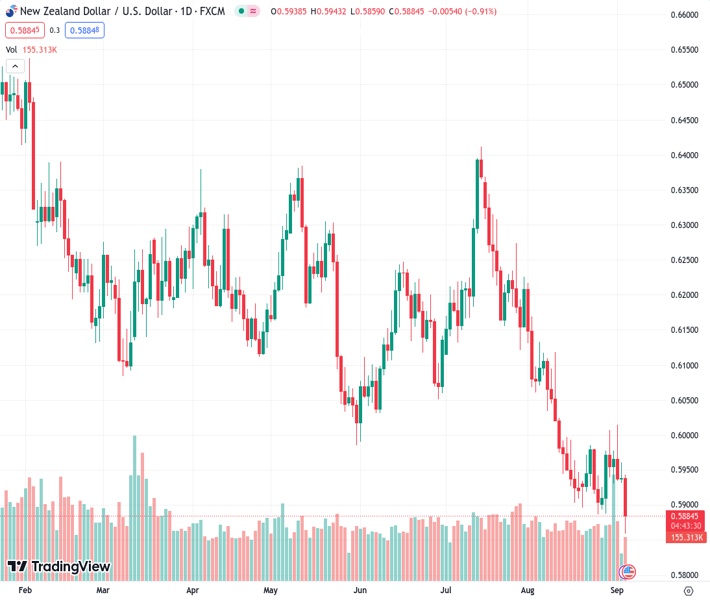
The New Zealand dollar against the US dollar, with a value of 0.58833, experienced a decrease of nearly 1%, dropping below the important threshold of 0.5900.
…
This is a premium post.
[s2If !current_user_can(access_s2member_level4)]Please register for FREE REGISTER to read full post below containing analysis. In case of any error or you think you are not able to read the full post below, please email us at support#nehcap.com [lwa][/s2If] [s2If current_user_can(access_s2member_level1)]
- The NZD/USD lost nearly 1%, falling below the key level of 0.5900.
The pair currently trades last at 0.58833.
The previous day high was 0.5961 while the previous day low was 0.5931. The daily 38.2% Fib levels comes at 0.5943, expected to provide resistance. Similarly, the daily 61.8% fib level is at 0.595, expected to provide resistance.
The NZD/USD faced selling pressure mainly driven by a stronger USD in a cautious market environment. The US reported weak Factory Orders from July, which declined faster than expected but didn’t stop the Greenback’s momentum. On the other hand, alongside the AUD, the NZD is the worst performer of the session after the Reserve Bank of Australia (RBA) decided to hold rates steady at 4.10%, just as expected.
No relevant data will be released for the US for the rest of the session, but its DXY index climbed to a multi-month high of 104.80 as the Greenback benefits from a cautious market sentiment. In that sense, markets await fresh catalysts to continue placing their bets on the next Federal Reserve (Fed) decisions. The World Interest Rates Probabilities (WIRP) suggests that markets still foresee some possibilities of the Fed pursuing an additional 0.25% tightening by the December meeting, with the target rate ultimately reaching 5.75%.
The New Zealander calendar was also empty on Tuesday. Meanwhile, the Interest Rates Probabilities (WIRP) tool suggests that investors are firmly convinced that the Reserve Bank of New Zealand (RBNZ) will not announce any rate increases leading up to the February meeting and will keep rates stable at 5.5%. In that sense, if the Fed doesn’t end its tightening cycle, monetary policy divergences may continue to weaken the NZD.
Analyzing the daily chart, the NZD/USD technical outlook is bearish in the short term. The Relative Strength Index (RSI) is comfortably positioned below its midline in negative territory. It has a southward slope, indicating a favourable selling momentum and it is further supported by the negative signal from the Moving Average Convergence Divergence (MACD), which displays red bars, underscoring the growing bearish momentum. Moreover, the pair is below the 20,100 and 200-day Simple Moving Averages (SMAs), indicating that the sellers dominate the broader perspective.
Support levels: 0.5850, 0.5830, 0.5800.
Resistance levels: 0.5900, 0.5950 (20-day SMA), 0.5970.
Technical Levels: Supports and Resistances
NZDUSD currently trading at 0.5882 at the time of writing. Pair opened at 0.594 and is trading with a change of -0.98 % .
| Overview | Overview.1 | |
|---|---|---|
| 0 | Today last price | 0.5882 |
| 1 | Today Daily Change | -0.0058 |
| 2 | Today Daily Change % | -0.9800 |
| 3 | Today daily open | 0.5940 |
The pair remains strongly bearish on the daily time frame. It trades below the 20 SMA @ 0.596, 50 SMA 0.6098, 100 SMA @ 0.6135 and 200 SMA @ 0.6219.
| Trends | Trends.1 | |
|---|---|---|
| 0 | Daily SMA20 | 0.5960 |
| 1 | Daily SMA50 | 0.6098 |
| 2 | Daily SMA100 | 0.6135 |
| 3 | Daily SMA200 | 0.6219 |
The previous day high was 0.5961 while the previous day low was 0.5931. The daily 38.2% Fib levels comes at 0.5943, expected to provide resistance. Similarly, the daily 61.8% fib level is at 0.595, expected to provide resistance.
Note the levels of interest below:
- Pivot support is noted at 0.5927, 0.5914, 0.5897
- Pivot resistance is noted at 0.5957, 0.5974, 0.5987
| Levels | Levels.1 |
|---|---|
| Previous Daily High | 0.5961 |
| Previous Daily Low | 0.5931 |
| Previous Weekly High | 0.6015 |
| Previous Weekly Low | 0.5887 |
| Previous Monthly High | 0.6219 |
| Previous Monthly Low | 0.5885 |
| Daily Fibonacci 38.2% | 0.5943 |
| Daily Fibonacci 61.8% | 0.5950 |
| Daily Pivot Point S1 | 0.5927 |
| Daily Pivot Point S2 | 0.5914 |
| Daily Pivot Point S3 | 0.5897 |
| Daily Pivot Point R1 | 0.5957 |
| Daily Pivot Point R2 | 0.5974 |
| Daily Pivot Point R3 | 0.5987 |
[/s2If]
Download Nehcap EAWe have two EAs that are operational on our LIVE accounts.
- EA-FIX: Check out the details here. Download EA-FIX . EA-FIX is a non-grid HFT scalper.
- EA-GROWTH: High quality low dd EA using trend grids. Download EA_GROWTHJoin Our Telegram Group
")


