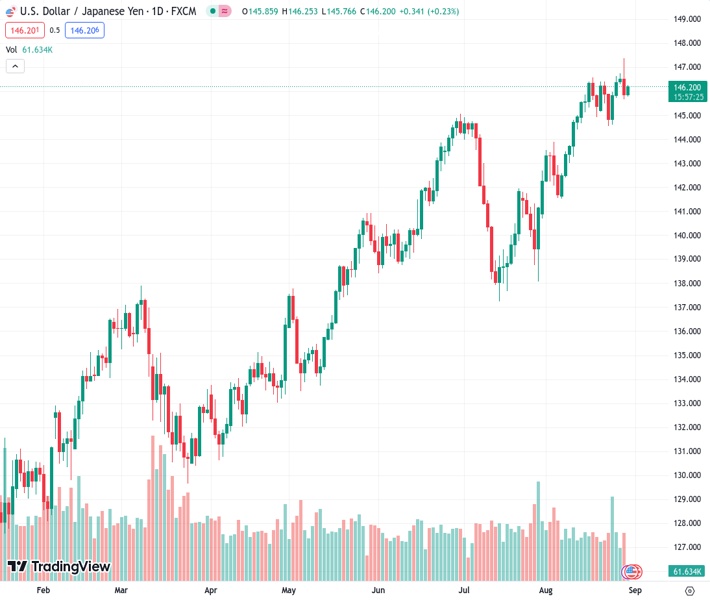
The USDJPY pair is currently trading at approximately 146.20, moving higher and recovering from its previous decline.
…
This is a premium post.
[s2If !current_user_can(access_s2member_level4)]Please register for FREE REGISTER to read full post below containing analysis. In case of any error or you think you are not able to read the full post below, please email us at support#nehcap.com [lwa][/s2If] [s2If current_user_can(access_s2member_level1)]
- USD/JPY trades higher around 146.20, retracing from recent losses.
The pair currently trades last at 146.237.
The previous day high was 147.38 while the previous day low was 145.67. The daily 38.2% Fib levels comes at 146.32, expected to provide resistance. Similarly, the daily 61.8% fib level is at 146.72, expected to provide resistance.
USD/JPY recovers from the previous day’s losses, trading higher around 146.20 at the time of writing during the Asian session on Wednesday. The pair registered losses due to the fall in the US Dollar (USD), which could be attributed to downbeat US Treasury yields and disappointing US economic data on Tuesday.
The pair could face the immediate barrier around the monthly high at 147.37 marked on Tuesday. A firm break above the latter could inspire the USD/JPY buyers to explore the area around the 148.00 psychological level, following November’s high at 148.82 level.
The 14-day Relative Strength Index (RSI) remains above 50, which suggests a bullish bias of the USD/JPY buyers. The Moving Average Convergence Divergence (MACD) line stays above the centerline and coincides with the signal line, which suggests that recent momentum is stronger.
On the flip side, the pair could meet the key support around the 14-day Exponential Moving Average (EMA) at 145.48, followed by the 23.6% Fibonacci retracement at 144.98 lined up with the 21-day EMA at 144.92.
A break below that level could put pressure on the USD/JPY pair to navigate around 38.2% Fibonacci retracement at 143.50.
In the short term, the underlying trend remains to be bullish as long as the USD/JPY stays above the 50-day EMA.
Technical Levels: Supports and Resistances
USDJPY currently trading at 146.21 at the time of writing. Pair opened at 145.88 and is trading with a change of 0.23 % .
| Overview | Overview.1 | |
|---|---|---|
| 0 | Today last price | 146.21 |
| 1 | Today Daily Change | 0.33 |
| 2 | Today Daily Change % | 0.23 |
| 3 | Today daily open | 145.88 |
The pair remains strongly bullish on the daily timeframe. It trades above its 20 SMA @ 144.87, 50 SMA 143.04, 100 SMA @ 140.14 and 200 SMA @ 136.73.
| Trends | Trends.1 | |
|---|---|---|
| 0 | Daily SMA20 | 144.87 |
| 1 | Daily SMA50 | 143.04 |
| 2 | Daily SMA100 | 140.14 |
| 3 | Daily SMA200 | 136.73 |
The previous day high was 147.38 while the previous day low was 145.67. The daily 38.2% Fib levels comes at 146.32, expected to provide resistance. Similarly, the daily 61.8% fib level is at 146.72, expected to provide resistance.
Note the levels of interest below:
- Pivot support is noted at 145.24, 144.6, 143.53
- Pivot resistance is noted at 146.95, 148.02, 148.66
| Levels | Levels.1 |
|---|---|
| Previous Daily High | 147.38 |
| Previous Daily Low | 145.67 |
| Previous Weekly High | 146.64 |
| Previous Weekly Low | 144.54 |
| Previous Monthly High | 144.91 |
| Previous Monthly Low | 137.24 |
| Daily Fibonacci 38.2% | 146.32 |
| Daily Fibonacci 61.8% | 146.72 |
| Daily Pivot Point S1 | 145.24 |
| Daily Pivot Point S2 | 144.60 |
| Daily Pivot Point S3 | 143.53 |
| Daily Pivot Point R1 | 146.95 |
| Daily Pivot Point R2 | 148.02 |
| Daily Pivot Point R3 | 148.66 |
[/s2If]
Download Nehcap EAWe have two EAs that are operational on our LIVE accounts.
- EA-FIX: Check out the details here. Download EA-FIX . EA-FIX is a non-grid HFT scalper.
- EA-GROWTH: High quality low dd EA using trend grids. Download EA_GROWTHJoin Our Telegram Group
")


