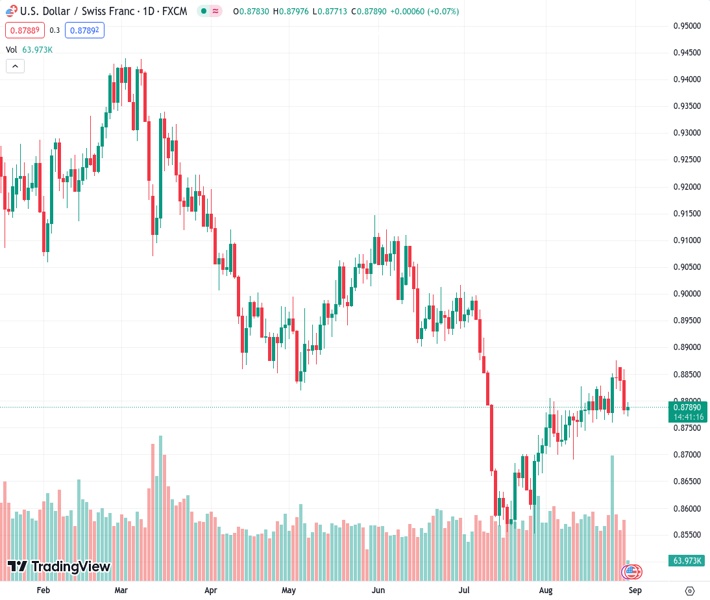
The USDCHF pair, currently at a rate of 0.87907, is facing difficulties in maintaining its rebound from the lowest point of the week. However, it has managed to achieve its first daily increase in three days.
…
This is a premium post.
[s2If !current_user_can(access_s2member_level4)]Please register for FREE REGISTER to read full post below containing analysis. In case of any error or you think you are not able to read the full post below, please email us at support#nehcap.com [lwa][/s2If] [s2If current_user_can(access_s2member_level1)]
- USD/CHF struggles to defend recovery from weekly low, prints the first daily gain in three.
The pair currently trades last at 0.87907.
The previous day high was 0.8859 while the previous day low was 0.8775. The daily 38.2% Fib levels comes at 0.8807, expected to provide resistance. Similarly, the daily 61.8% fib level is at 0.8827, expected to provide resistance.
USD/CHF clings to mild gains around 0.8790 as it consolidates the biggest daily loss since late July, marked the previous day, amid the early hours of Wednesday’s European session.
It’s worth noting that the US Dollar’s positioning for top-tier data and the market’s reassessment of the previous dovish bias about the Federal Reserve (Fed) allowed the Swiss Franc (CHF) pair to print the first daily gains in three.
That said, the US Dollar Index (DXY) clings to mild gains after the previous day’s US consumer confidence, employment and housing data flagged fears of the Fed’s policy pivot, especially after Fed Chair Jerome Powell highlighted the data-dependency for future moves to defend the hawkish bias. The same drowned the Greenback and the US Treasury bond yields.
Elsewhere, the mixed concerns about the US-China ties and indecision about the softer landing also fuel the USD/CHF rebound. China recently conveyed its dislike for the US Commerce Secretary Gina Raimondo’s complaints about the hardships for the US firms in China. Previously, chatters about the early rate cuts from the People’s Bank of China (PBoC) and a cut into the mortgage rates, as well as likely improvement in the US-China ties, favored the market’s optimism. It should be noted that the International Monetary Fund’s (IMF) readiness to be more cautious while allocating the Special Drawing Rights (SDRs) in the future, due to the current environment of higher interest rates and inflation, also seems to renew the US Dollar’s demand.
Amid these plays, the US S&P 500 Futures print mild gains and prod the riskier assets, which in turn propel the USD/CHF prices. That said, the US 10-year Treasury bond yields seesaw around 4.15% after refreshing the weekly low the previous day.
Looking ahead, US ADP Employment Change, the final readings of the US second quarter (Q2) Gross Domestic Product (GDP) and the Personal Consumption Expenditure (PCE) data will be closely observed to confirm the Fed’s policy pivot concerns. Should the scheduled data confirm the need for exiting the restrictive monetary policies, the USD/CHF may witness further downside.
A three-month-old previous support line puts a floor under the USD/CHF prices near 0.8765, which in turn joins upbeat oscillators to suggest the pair’s recovery towards the 100-DMA resistance of around 0.8885.
Technical Levels: Supports and Resistances
USDCHF currently trading at 0.8793 at the time of writing. Pair opened at 0.8784 and is trading with a change of 0.10% % .
| Overview | Overview.1 | |
|---|---|---|
| 0 | Today last price | 0.8793 |
| 1 | Today Daily Change | 0.0009 |
| 2 | Today Daily Change % | 0.10% |
| 3 | Today daily open | 0.8784 |
The pair is trading above its 20 Daily moving average @ 0.8785, above its 50 Daily moving average @ 0.8791 , below its 100 Daily moving average @ 0.8885 and below its 200 Daily moving average @ 0.9076
| Trends | Trends.1 | |
|---|---|---|
| 0 | Daily SMA20 | 0.8785 |
| 1 | Daily SMA50 | 0.8791 |
| 2 | Daily SMA100 | 0.8885 |
| 3 | Daily SMA200 | 0.9076 |
The previous day high was 0.8859 while the previous day low was 0.8775. The daily 38.2% Fib levels comes at 0.8807, expected to provide resistance. Similarly, the daily 61.8% fib level is at 0.8827, expected to provide resistance.
Note the levels of interest below:
- Pivot support is noted at 0.8753, 0.8722, 0.8669
- Pivot resistance is noted at 0.8837, 0.889, 0.8921
| Levels | Levels.1 |
|---|---|
| Previous Daily High | 0.8859 |
| Previous Daily Low | 0.8775 |
| Previous Weekly High | 0.8876 |
| Previous Weekly Low | 0.8760 |
| Previous Monthly High | 0.9005 |
| Previous Monthly Low | 0.8552 |
| Daily Fibonacci 38.2% | 0.8807 |
| Daily Fibonacci 61.8% | 0.8827 |
| Daily Pivot Point S1 | 0.8753 |
| Daily Pivot Point S2 | 0.8722 |
| Daily Pivot Point S3 | 0.8669 |
| Daily Pivot Point R1 | 0.8837 |
| Daily Pivot Point R2 | 0.8890 |
| Daily Pivot Point R3 | 0.8921 |
[/s2If]
Download Nehcap EAWe have two EAs that are operational on our LIVE accounts.
- EA-FIX: Check out the details here. Download EA-FIX . EA-FIX is a non-grid HFT scalper.
- EA-GROWTH: High quality low dd EA using trend grids. Download EA_GROWTHJoin Our Telegram Group
")


