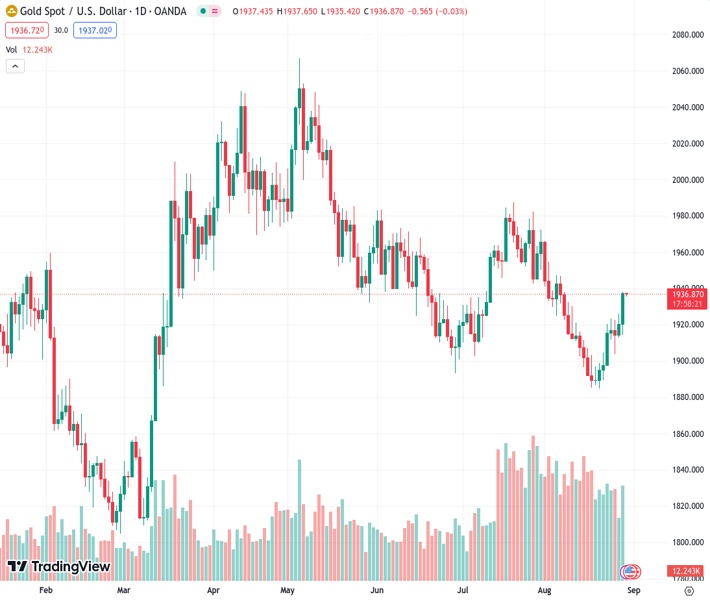
The price of gold, currently at $1,936.75, continues to stay at its highest level in three weeks, maintaining a steady trend for the past two days. According to the perspective of @nehcap, it is anticipated that there will be additional gains in the future.
…
This is a premium post.
[s2If !current_user_can(access_s2member_level4)]Please register for FREE REGISTER to read full post below containing analysis. In case of any error or you think you are not able to read the full post below, please email us at support#nehcap.com [lwa][/s2If] [s2If current_user_can(access_s2member_level1)]
- Gold Price remains sidelined at three-week high, prods two-day uptrend.
The pair currently trades last at 1936.75.
The previous day high was 1938.21 while the previous day low was 1914.49. The daily 38.2% Fib levels comes at 1929.15, expected to provide support. Similarly, the daily 61.8% fib level is at 1923.55, expected to provide support.
Gold Price (XAU/USD) lacks upside momentum at the highest level in three weeks, making around to $1,937-38 of late, as traders seek more clues to confirm the dovish bias about the US Federal Reserve (Fed) that gained momentum after the previous day’s downbeat US data. Also challenging the XAU/USD bulls could be the mixed concerns about the US-China ties and the sluggish US Treasury bond yields.
The cautious mood ahead of the US ADP Employment Change, the final readings of the US second quarter (Q2) Gross Domestic Product (GDP) and the Personal Consumption Expenditure (PCE) seem to prod the Gold buyers at the multi-day high. That said, the previous day’s disappointing US consumer confidence, employment and housing data flagged fears of the Fed’s policy pivot, especially after Fed Chair Jerome Powell highlighted the data-dependency for future moves to defend the hawkish bias.
Elsewhere, China’s dislike for the US Commerce Secretary Gina Raimondo’s complaints about the hardships for the US firms in China prods the Gold buyers. On the same line could be the International Monetary Fund’s (IMF) readiness to be more cautious while allocating the Special Drawing Rights (SDRs) in the future, due to the current environment of higher interest rates and inflation.
Amid these plays, S&P 500 Futures struggle to extend the three-day uptrend while the US Dollar Index (DXY) remains sidelined around 103.55 after falling the most in six weeks. That said, the US Treasury bond yields remain sidelined at a two-week low.
Looking forward, the US data and China headlines will be crucial for clear directions as XAU/USD bulls appear running out of steam.
Gold Price struggles to justify the clear upside break of a monthly horizontal resistance, now support, as well as the 200-SMA, amid the overbought RSI (14) line.
Also challenging the XAU/USD bulls is the 50% Fibonacci retracement of its July-August fall, around $1,836.
In a case where the Gold Price remains firmer past the 200-SMA and the previously stated resistance-turned-support area, as well as ignore the overbought RSI, the XAU/USD bulls can challenge the 61.8% Fibonacci ratio of around $1,948.
However, a downward-sloping resistance line from July 20, close to $1,958 at the latest, will challenge the Gold buyers afterward.
Meanwhile, a clear downside break of the aforementioned key moving average and the support zone, respectively near $1,933 and $1,932–30, could recall the Gold sellers.
Even so, an ascending trend line from August 31, near $1,817 by the press time, can challenge the XAU/USD bears before giving them control.
Overall, the Gold Price remains on the bull’s radar unless it breaks the $1,817 support.
Trend: Further upside expected
Technical Levels: Supports and Resistances
XAUUSD currently trading at 1937.1 at the time of writing. Pair opened at 1937.56 and is trading with a change of -0.02% % .
| Overview | Overview.1 | |
|---|---|---|
| 0 | Today last price | 1937.1 |
| 1 | Today Daily Change | -0.46 |
| 2 | Today Daily Change % | -0.02% |
| 3 | Today daily open | 1937.56 |
The pair is trading above its 20 Daily moving average @ 1914.57, above its 50 Daily moving average @ 1930.17 , below its 100 Daily moving average @ 1956.66 and above its 200 Daily moving average @ 1912.0
| Trends | Trends.1 | |
|---|---|---|
| 0 | Daily SMA20 | 1914.57 |
| 1 | Daily SMA50 | 1930.17 |
| 2 | Daily SMA100 | 1956.66 |
| 3 | Daily SMA200 | 1912.00 |
The previous day high was 1938.21 while the previous day low was 1914.49. The daily 38.2% Fib levels comes at 1929.15, expected to provide support. Similarly, the daily 61.8% fib level is at 1923.55, expected to provide support.
Note the levels of interest below:
- Pivot support is noted at 1921.96, 1906.37, 1898.24
- Pivot resistance is noted at 1945.68, 1953.81, 1969.4
| Levels | Levels.1 |
|---|---|
| Previous Daily High | 1938.21 |
| Previous Daily Low | 1914.49 |
| Previous Weekly High | 1923.43 |
| Previous Weekly Low | 1884.85 |
| Previous Monthly High | 1987.54 |
| Previous Monthly Low | 1902.77 |
| Daily Fibonacci 38.2% | 1929.15 |
| Daily Fibonacci 61.8% | 1923.55 |
| Daily Pivot Point S1 | 1921.96 |
| Daily Pivot Point S2 | 1906.37 |
| Daily Pivot Point S3 | 1898.24 |
| Daily Pivot Point R1 | 1945.68 |
| Daily Pivot Point R2 | 1953.81 |
| Daily Pivot Point R3 | 1969.40 |
[/s2If]
Download Nehcap EAWe have two EAs that are operational on our LIVE accounts.
- EA-FIX: Check out the details here. Download EA-FIX . EA-FIX is a non-grid HFT scalper.
- EA-GROWTH: High quality low dd EA using trend grids. Download EA_GROWTHJoin Our Telegram Group
")


