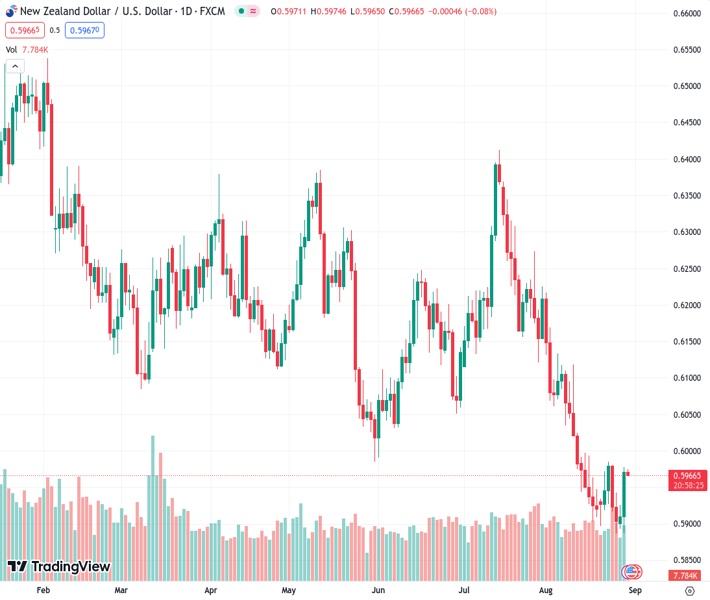
The NZDUSD currency pair has increased slightly from 0.59666 to 0.5970 due to the decline in the value of the USD.
…
This is a premium post.
[s2If !current_user_can(access_s2member_level4)]Please register for FREE REGISTER to read full post below containing analysis. In case of any error or you think you are not able to read the full post below, please email us at support#nehcap.com [lwa][/s2If] [s2If current_user_can(access_s2member_level1)]
- NZD/USD edges higher to 0.5970 amid the weakening of USD.
The pair currently trades last at 0.59666.
The previous day high was 0.5939 while the previous day low was 0.5894. The daily 38.2% Fib levels comes at 0.5922, expected to provide support. Similarly, the daily 61.8% fib level is at 0.5911, expected to provide support.
The NZD/USD pair attracts some buyers and gains momentum below the 0.6000 barrier during the early Asian session on Wednesday. The pair currently trades around 0.5971, up 0.01% on the day.
The latest data by Statistics New Zealand showed that the country’s Building Permits MoM for July fell 5.2% from an increase of 3.4% in the previous month. The figure came in below the market expectation of a 0.2% rise.
Apart from the data, the chief economist of the Reserve Bank of New Zealand (RBNZ) stated last week that policymakers would cut the OCR earlier than signaled if China experienced a more significant slowdown than the RBNZ anticipates.
About the US-Sino relationship, US Commerce Secretary Gina Raimondo visited Beijing for four days and brought up concerns from American businesses that China is “uninvestible” and “risky to do business” because of its fines, raids, and other actions, said Reuters. The renewed trade tension between the world’s two largest economies could exert pressure on the China-proxy Kiwi and act as a headwind for the NZD/USD pair.
On the US Dollar front, the Greenback faces some follow-through selling following the softer economic data. The US Job Openings and Labor Turnover Survey (JOLTS) for July decreased to 8.827M versus 9.165M prior and against the 9.465M expected. The figure showed the lowest reading since March 2021. Meanwhile, the Conference Board’s (CB) Consumer Confidence Index for August dropped to 106.10 from 114.00 in July, below the market consensus of 116.0. The S&P/Case-Shiller Home Price Indices improved to -1.2% YoY versus -1.7% prior and -1.2% market expectations.
Federal Reserve (Fed) Chairman Jerome Powell stated last week that the central bank opened the door for an additional rate hike if required. But it would be determined by incoming data. That said, the labor market condition might influence the USD’s short-term direction. Market players await more US labor data due later this week for fresh impetus and these events could trigger the volatility in the market.
Market participants will monitor the US ADP private employment and estimate Q2 Gross Domestic Product (GDP) data due on Wednesday. Later in the week, the US preliminary Gross Domestic Product Annualized (GDP), Core Personal Consumption Expenditures (PCE) Index, and the weekly Jobless Claims will be released. The attention will shift to the Nonfarm Payrolls (NFP) data on Friday. The events will be critical for determining a clear movement for the NZD/USD pair.
Technical Levels: Supports and Resistances
NZDUSD currently trading at 0.5968 at the time of writing. Pair opened at 0.591 and is trading with a change of 0.98 % .
| Overview | Overview.1 | |
|---|---|---|
| 0 | Today last price | 0.5968 |
| 1 | Today Daily Change | 0.0058 |
| 2 | Today Daily Change % | 0.9800 |
| 3 | Today daily open | 0.5910 |
The pair remains strongly bearish on the daily time frame. It trades below the 20 SMA @ 0.5996, 50 SMA 0.6119, 100 SMA @ 0.6149 and 200 SMA @ 0.6226.
| Trends | Trends.1 | |
|---|---|---|
| 0 | Daily SMA20 | 0.5996 |
| 1 | Daily SMA50 | 0.6119 |
| 2 | Daily SMA100 | 0.6149 |
| 3 | Daily SMA200 | 0.6226 |
The previous day high was 0.5939 while the previous day low was 0.5894. The daily 38.2% Fib levels comes at 0.5922, expected to provide support. Similarly, the daily 61.8% fib level is at 0.5911, expected to provide support.
Note the levels of interest below:
- Pivot support is noted at 0.589, 0.5869, 0.5844
- Pivot resistance is noted at 0.5935, 0.596, 0.598
| Levels | Levels.1 |
|---|---|
| Previous Daily High | 0.5939 |
| Previous Daily Low | 0.5894 |
| Previous Weekly High | 0.5987 |
| Previous Weekly Low | 0.5885 |
| Previous Monthly High | 0.6413 |
| Previous Monthly Low | 0.6120 |
| Daily Fibonacci 38.2% | 0.5922 |
| Daily Fibonacci 61.8% | 0.5911 |
| Daily Pivot Point S1 | 0.5890 |
| Daily Pivot Point S2 | 0.5869 |
| Daily Pivot Point S3 | 0.5844 |
| Daily Pivot Point R1 | 0.5935 |
| Daily Pivot Point R2 | 0.5960 |
| Daily Pivot Point R3 | 0.5980 |
[/s2If]
Download Nehcap EAWe have two EAs that are operational on our LIVE accounts.
- EA-FIX: Check out the details here. Download EA-FIX . EA-FIX is a non-grid HFT scalper.
- EA-GROWTH: High quality low dd EA using trend grids. Download EA_GROWTHJoin Our Telegram Group
")


