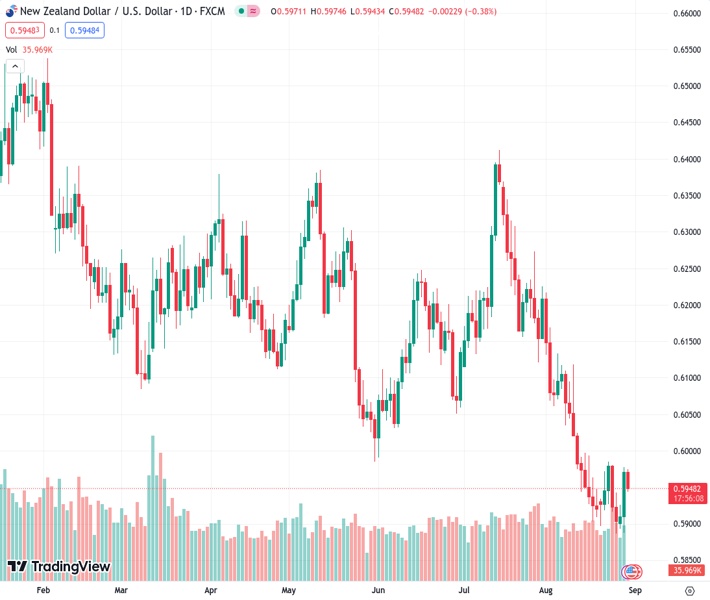
The NZDUSD currency pair has experienced significant gains in a single day, the largest in six weeks, despite being in a downward trend for the past two weeks. Analysts, like Nehcap, believe that any potential losses for the pair will be limited.
…
This is a premium post.
[s2If !current_user_can(access_s2member_level4)]Please register for FREE REGISTER to read full post below containing analysis. In case of any error or you think you are not able to read the full post below, please email us at support#nehcap.com [lwa][/s2If] [s2If current_user_can(access_s2member_level1)]
- NZD/USD pares the biggest daily gains in six weeks within fortnight-old descending trend channel.
The pair currently trades last at 0.59486.
The previous day high was 0.5979 while the previous day low was 0.5887. The daily 38.2% Fib levels comes at 0.5944, expected to provide support. Similarly, the daily 61.8% fib level is at 0.5922, expected to provide support.
NZD/USD takes offers to refresh the intraday low near 0.5945 during early Wednesday morning in Europe. In doing so, the Kiwi pair justifies the downbeat New Zealand (NZ) housing data, as well as portrays the market’s cautious mood ahead of the top-tier US data.
New Zealand Building Permits for July marked a notable slump of 5.2% MoM versus 0.2% expected and 3.4% prior (revised from 3.5%).
It’s worth noting that the US ADP Employment Change, the final readings of the US second quarter (Q2) Gross Domestic Product (GDP) and the Personal Consumption Expenditure (PCE) are on the calendar and prod the sentiment, as well as the NZD/USD price. With this, the US Dollar Index (DXY) also licks its wounds around 103.60 after falling the most in six weeks the previous day.
Technically, a retreat from the top-line of a two-week-old bearish channel, as well as a downside break of the 100-SMA, favors the NZD/USD sellers to aim for the previous resistance line stretched from late July, close to 0.5920 at the latest.
However, the bullish MACD signals and the bottom line of the stated channel, near 0.5890 by the press time, challenge further downside of the Kiwi pair past 0.5920.
Meanwhile, the 100-SMA and the channel’s top-line, respectively near 0.5965 and 0.5980, guard immediate recovery of the NZD/USD pair.
Following that, a run-up towards the 200-SMA hurdle of around 0.6080 can’t be ruled out.
Trend: Limited downside expected
Technical Levels: Supports and Resistances
NZDUSD currently trading at 0.5948 at the time of writing. Pair opened at 0.5972 and is trading with a change of -0.40% % .
| Overview | Overview.1 | |
|---|---|---|
| 0 | Today last price | 0.5948 |
| 1 | Today Daily Change | -0.0024 |
| 2 | Today Daily Change % | -0.40% |
| 3 | Today daily open | 0.5972 |
The pair remains strongly bearish on the daily time frame. It trades below the 20 SMA @ 0.5987, 50 SMA 0.6115, 100 SMA @ 0.6146 and 200 SMA @ 0.6225.
| Trends | Trends.1 | |
|---|---|---|
| 0 | Daily SMA20 | 0.5987 |
| 1 | Daily SMA50 | 0.6115 |
| 2 | Daily SMA100 | 0.6146 |
| 3 | Daily SMA200 | 0.6225 |
The previous day high was 0.5979 while the previous day low was 0.5887. The daily 38.2% Fib levels comes at 0.5944, expected to provide support. Similarly, the daily 61.8% fib level is at 0.5922, expected to provide support.
Note the levels of interest below:
- Pivot support is noted at 0.5913, 0.5854, 0.5821
- Pivot resistance is noted at 0.6005, 0.6038, 0.6097
| Levels | Levels.1 |
|---|---|
| Previous Daily High | 0.5979 |
| Previous Daily Low | 0.5887 |
| Previous Weekly High | 0.5987 |
| Previous Weekly Low | 0.5885 |
| Previous Monthly High | 0.6413 |
| Previous Monthly Low | 0.6120 |
| Daily Fibonacci 38.2% | 0.5944 |
| Daily Fibonacci 61.8% | 0.5922 |
| Daily Pivot Point S1 | 0.5913 |
| Daily Pivot Point S2 | 0.5854 |
| Daily Pivot Point S3 | 0.5821 |
| Daily Pivot Point R1 | 0.6005 |
| Daily Pivot Point R2 | 0.6038 |
| Daily Pivot Point R3 | 0.6097 |
[/s2If]
Download Nehcap EAWe have two EAs that are operational on our LIVE accounts.
- EA-FIX: Check out the details here. Download EA-FIX . EA-FIX is a non-grid HFT scalper.
- EA-GROWTH: High quality low dd EA using trend grids. Download EA_GROWTHJoin Our Telegram Group
")


