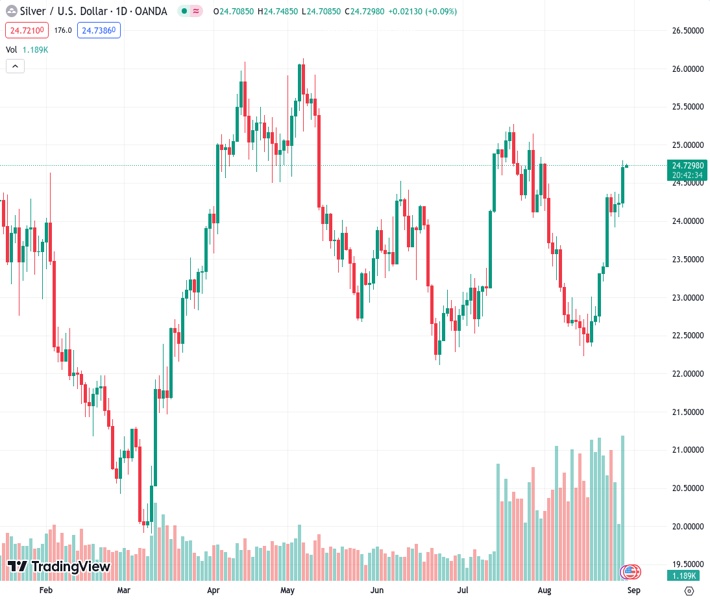
The current price of silver at 24.725 is facing difficulty in surpassing the significant resistance level at the highest point observed in the past month. According to the view of Nehcap, a decline in price is anticipated to occur.
…
This is a premium post.
[s2If !current_user_can(access_s2member_level4)]Please register for FREE REGISTER to read full post below containing analysis. In case of any error or you think you are not able to read the full post below, please email us at support#nehcap.com [lwa][/s2If] [s2If current_user_can(access_s2member_level1)]
- Silver Price struggles with the key upside hurdle at monthly high.
The pair currently trades last at 24.725.
The previous day high was 24.8 while the previous day low was 24.18. The daily 38.2% Fib levels comes at 24.56, expected to provide support. Similarly, the daily 61.8% fib level is at 24.41, expected to provide support.
Silver Price (XAG/USD) remains sidelined near $24.70–75 during early Wednesday as bulls jostle with the key upside hurdle ahead of the US data.
It’s worth noting that the nearly overbought RSI joins a 16-week-old falling resistance line surrounding $24.80 to challenge the XAG/USD buyers.
However, the bullish MACD signals a daily closing beyond the four-month-long horizontal resistance zone, now immediate support around $24.50–40, which will test the Silver sellers.
Following that, the 100-DMA support of around $23.95 will precede the 50% and 61.8% Fibonacci retracements of March–May upside, respectively near $23.00 and $22.30, to offer a bumpy ride to the XAG/USD bears.
Meanwhile, a daily closing beyond the aforementioned resistance line of around $24.80 needs support from the US ADP Employment Change, the final readings of the US second quarter (Q2) Gross Domestic Product (GDP) and the Personal Consumption Expenditure (PCE).
Should the softer US data join the Silver Price upside beyond the immediate resistance line, the bulls can challenge the previous monthly high of around $25.30 ahead of targeting the yearly high marked in May at around $26.15.
Trend: Pullback expected
Technical Levels: Supports and Resistances
XAGUSD currently trading at 24.72 at the time of writing. Pair opened at 24.72 and is trading with a change of 0.00% % .
| Overview | Overview.1 | |
|---|---|---|
| 0 | Today last price | 24.72 |
| 1 | Today Daily Change | 0.00 |
| 2 | Today Daily Change % | 0.00% |
| 3 | Today daily open | 24.72 |
The pair remains strongly bullish on the daily timeframe. It trades above its 20 SMA @ 23.31, 50 SMA 23.56, 100 SMA @ 23.97 and 200 SMA @ 23.39.
| Trends | Trends.1 | |
|---|---|---|
| 0 | Daily SMA20 | 23.31 |
| 1 | Daily SMA50 | 23.56 |
| 2 | Daily SMA100 | 23.97 |
| 3 | Daily SMA200 | 23.39 |
The previous day high was 24.8 while the previous day low was 24.18. The daily 38.2% Fib levels comes at 24.56, expected to provide support. Similarly, the daily 61.8% fib level is at 24.41, expected to provide support.
Note the levels of interest below:
- Pivot support is noted at 24.33, 23.94, 23.71
- Pivot resistance is noted at 24.95, 25.18, 25.57
| Levels | Levels.1 |
|---|---|
| Previous Daily High | 24.80 |
| Previous Daily Low | 24.18 |
| Previous Weekly High | 24.38 |
| Previous Weekly Low | 22.67 |
| Previous Monthly High | 25.27 |
| Previous Monthly Low | 22.52 |
| Daily Fibonacci 38.2% | 24.56 |
| Daily Fibonacci 61.8% | 24.41 |
| Daily Pivot Point S1 | 24.33 |
| Daily Pivot Point S2 | 23.94 |
| Daily Pivot Point S3 | 23.71 |
| Daily Pivot Point R1 | 24.95 |
| Daily Pivot Point R2 | 25.18 |
| Daily Pivot Point R3 | 25.57 |
[/s2If]
Download Nehcap EAWe have two EAs that are operational on our LIVE accounts.
- EA-FIX: Check out the details here. Download EA-FIX . EA-FIX is a non-grid HFT scalper.
- EA-GROWTH: High quality low dd EA using trend grids. Download EA_GROWTHJoin Our Telegram Group
")


